Purpose
CFA is providing insights to support public health planning and response to the fall and winter respiratory virus season. Below, we highlight our current and upcoming products related to respiratory virus season. We will share additional products as the season progresses.
Current Epidemic Trends
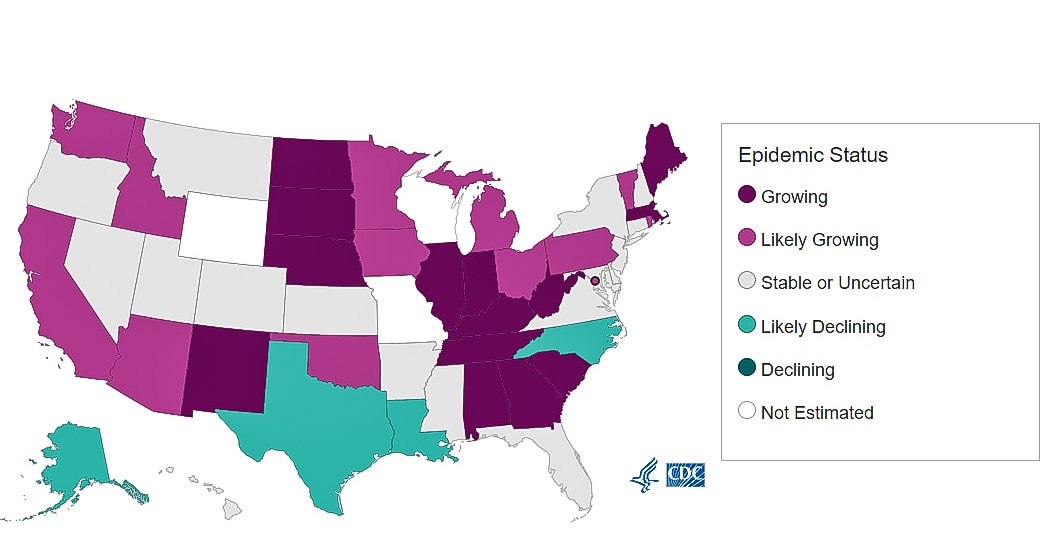
CFA provides weekly estimates of Rt, the time-varying reproductive number, at the national and state levels to determine the current epidemic trends. Estimates are currently available for COVID-19 and influenza. Rt is a data-driven measure of disease transmission. Rt can tell us whether infections are growing, declining, or remaining stable, and can help public health practitioners prepare and respond to these viruses – read more about Rt and how we calculate it.
Improving CDC’s Tools for Assessing Epidemic Trends
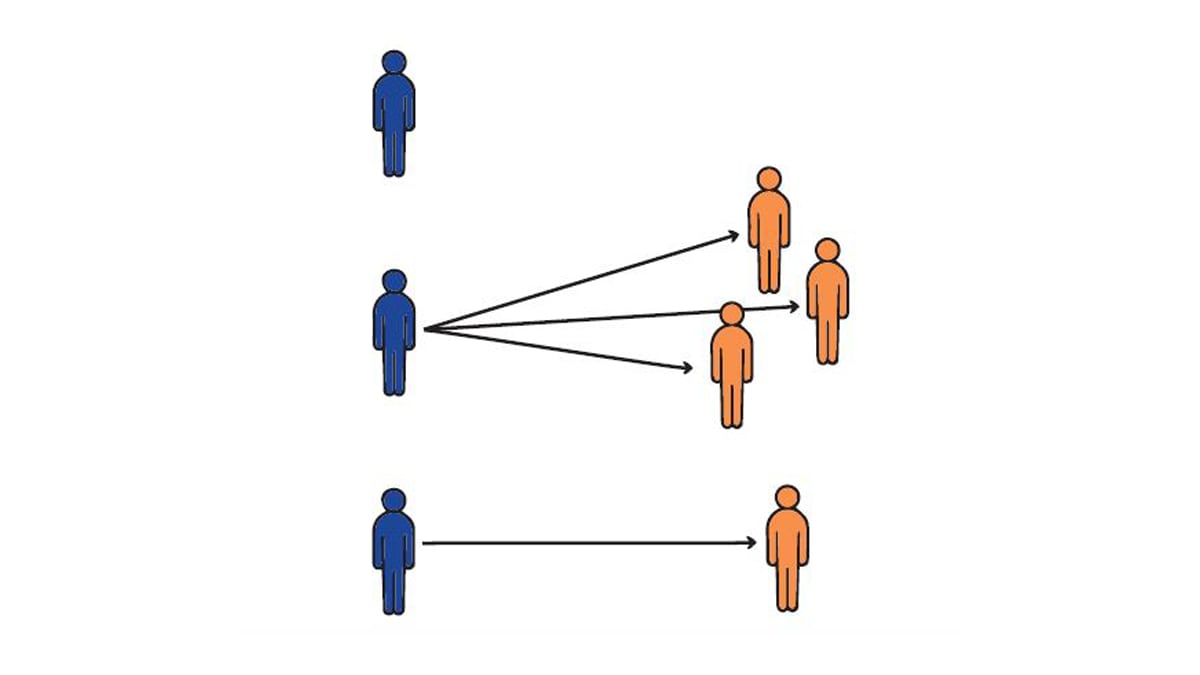
CFA is building modeling tools and computational pipelines so that we can analyze data quickly and accurately in response to outbreaks. Our goal is to make these tools accessible to federal, state, tribal, territorial, local, and academic partners. One of these efforts is to estimate the time-varying reproductive number, Rt, a measure that helps us quickly assess whether infections are increasing or decreasing.
Respiratory Disease Season Outlook
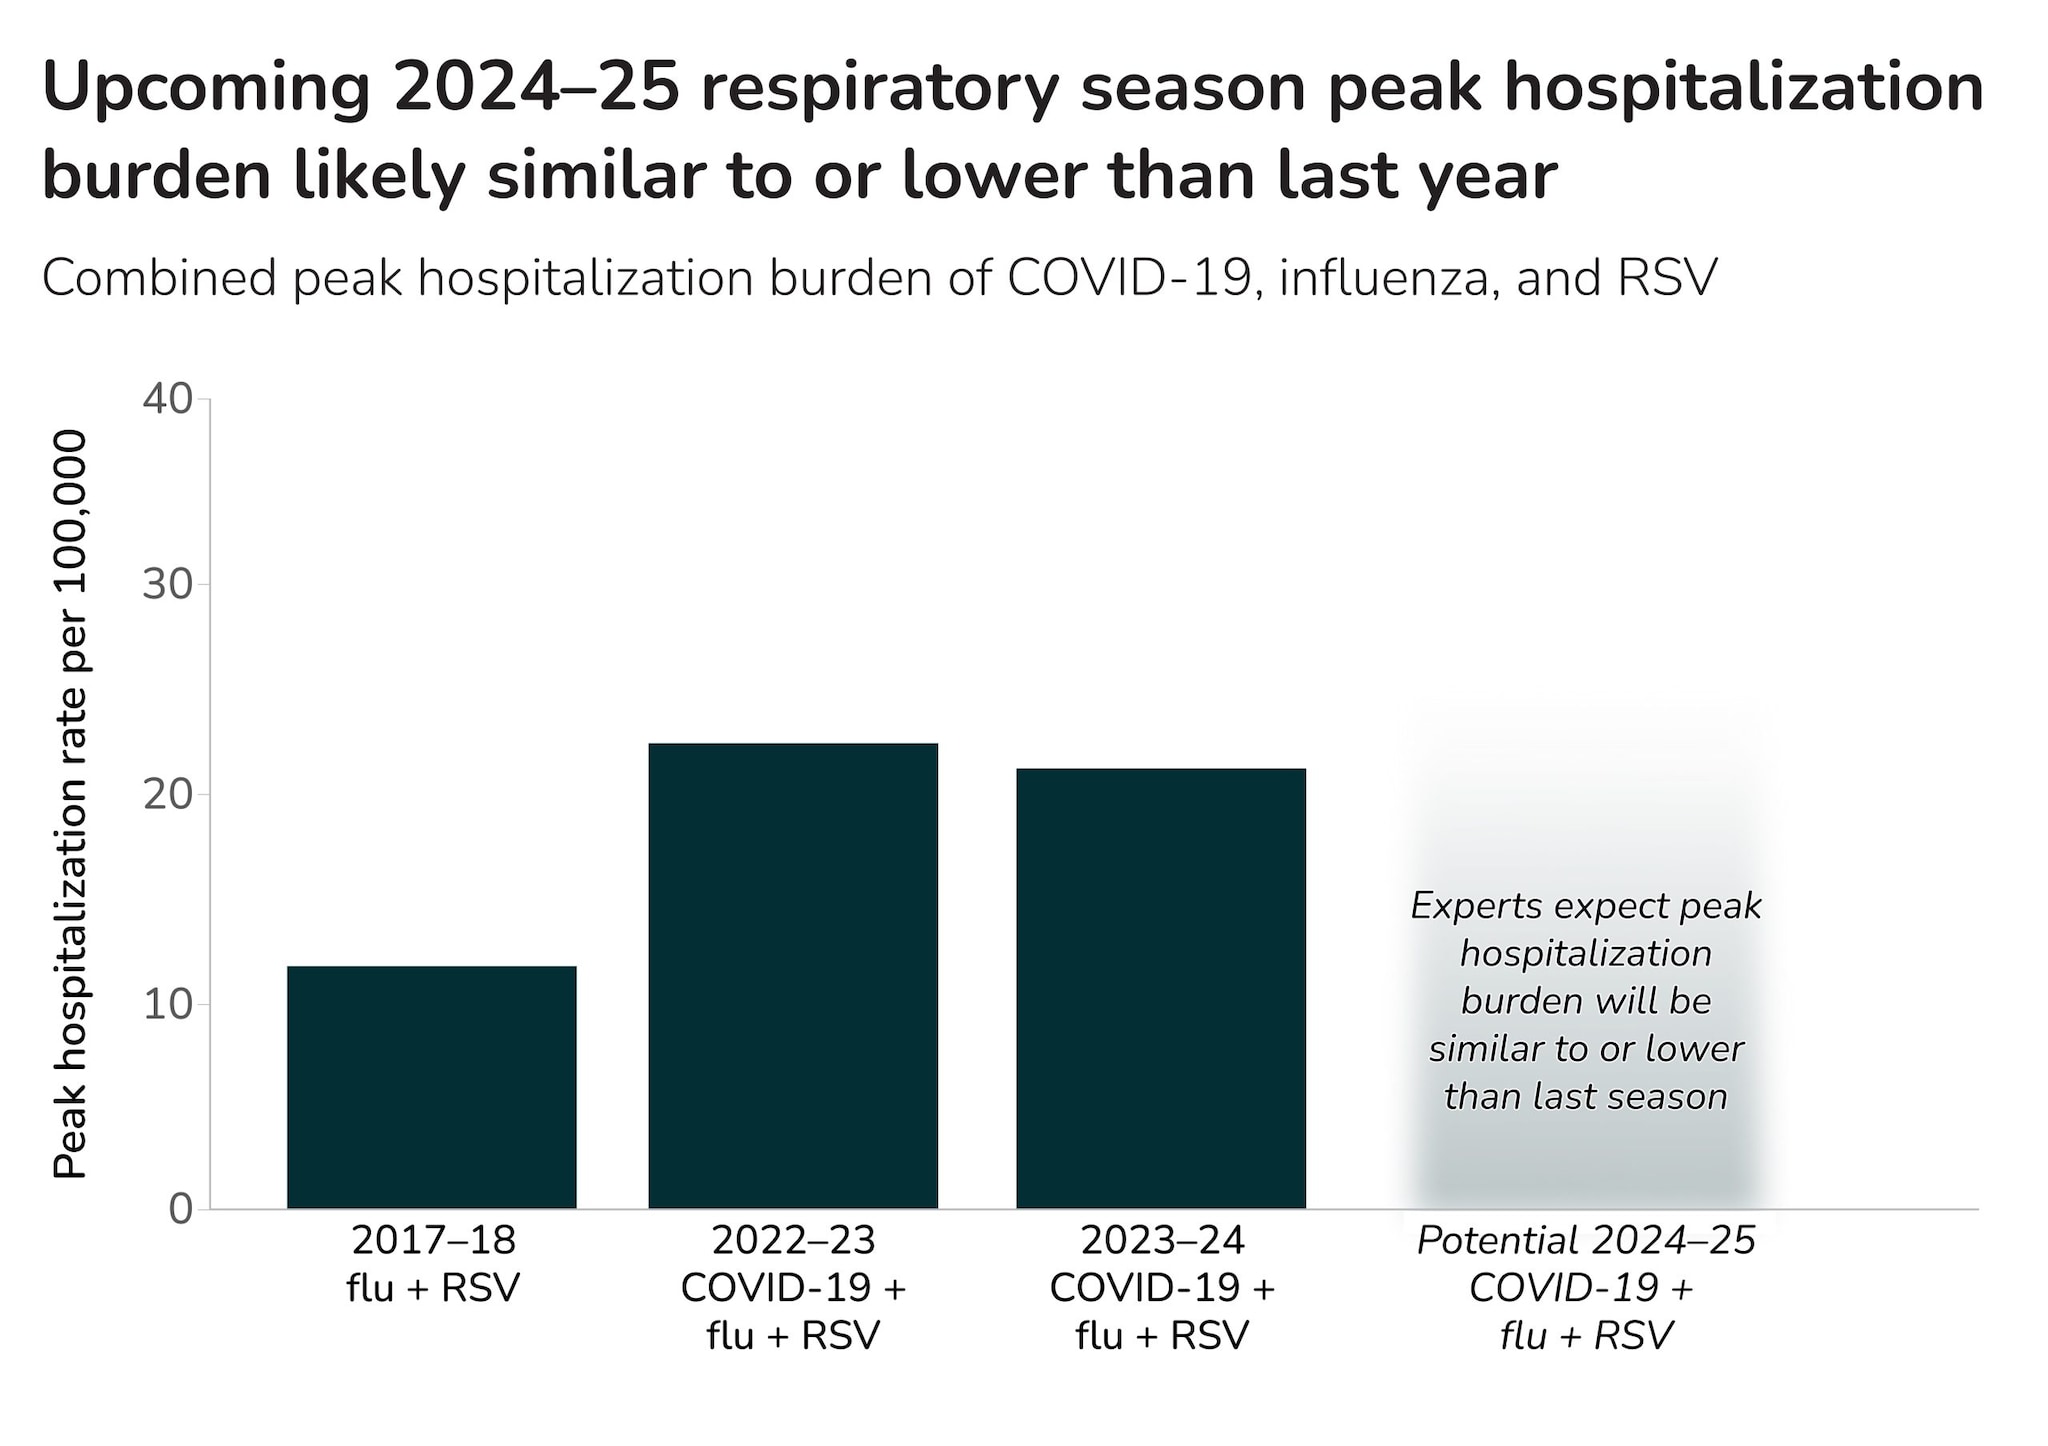
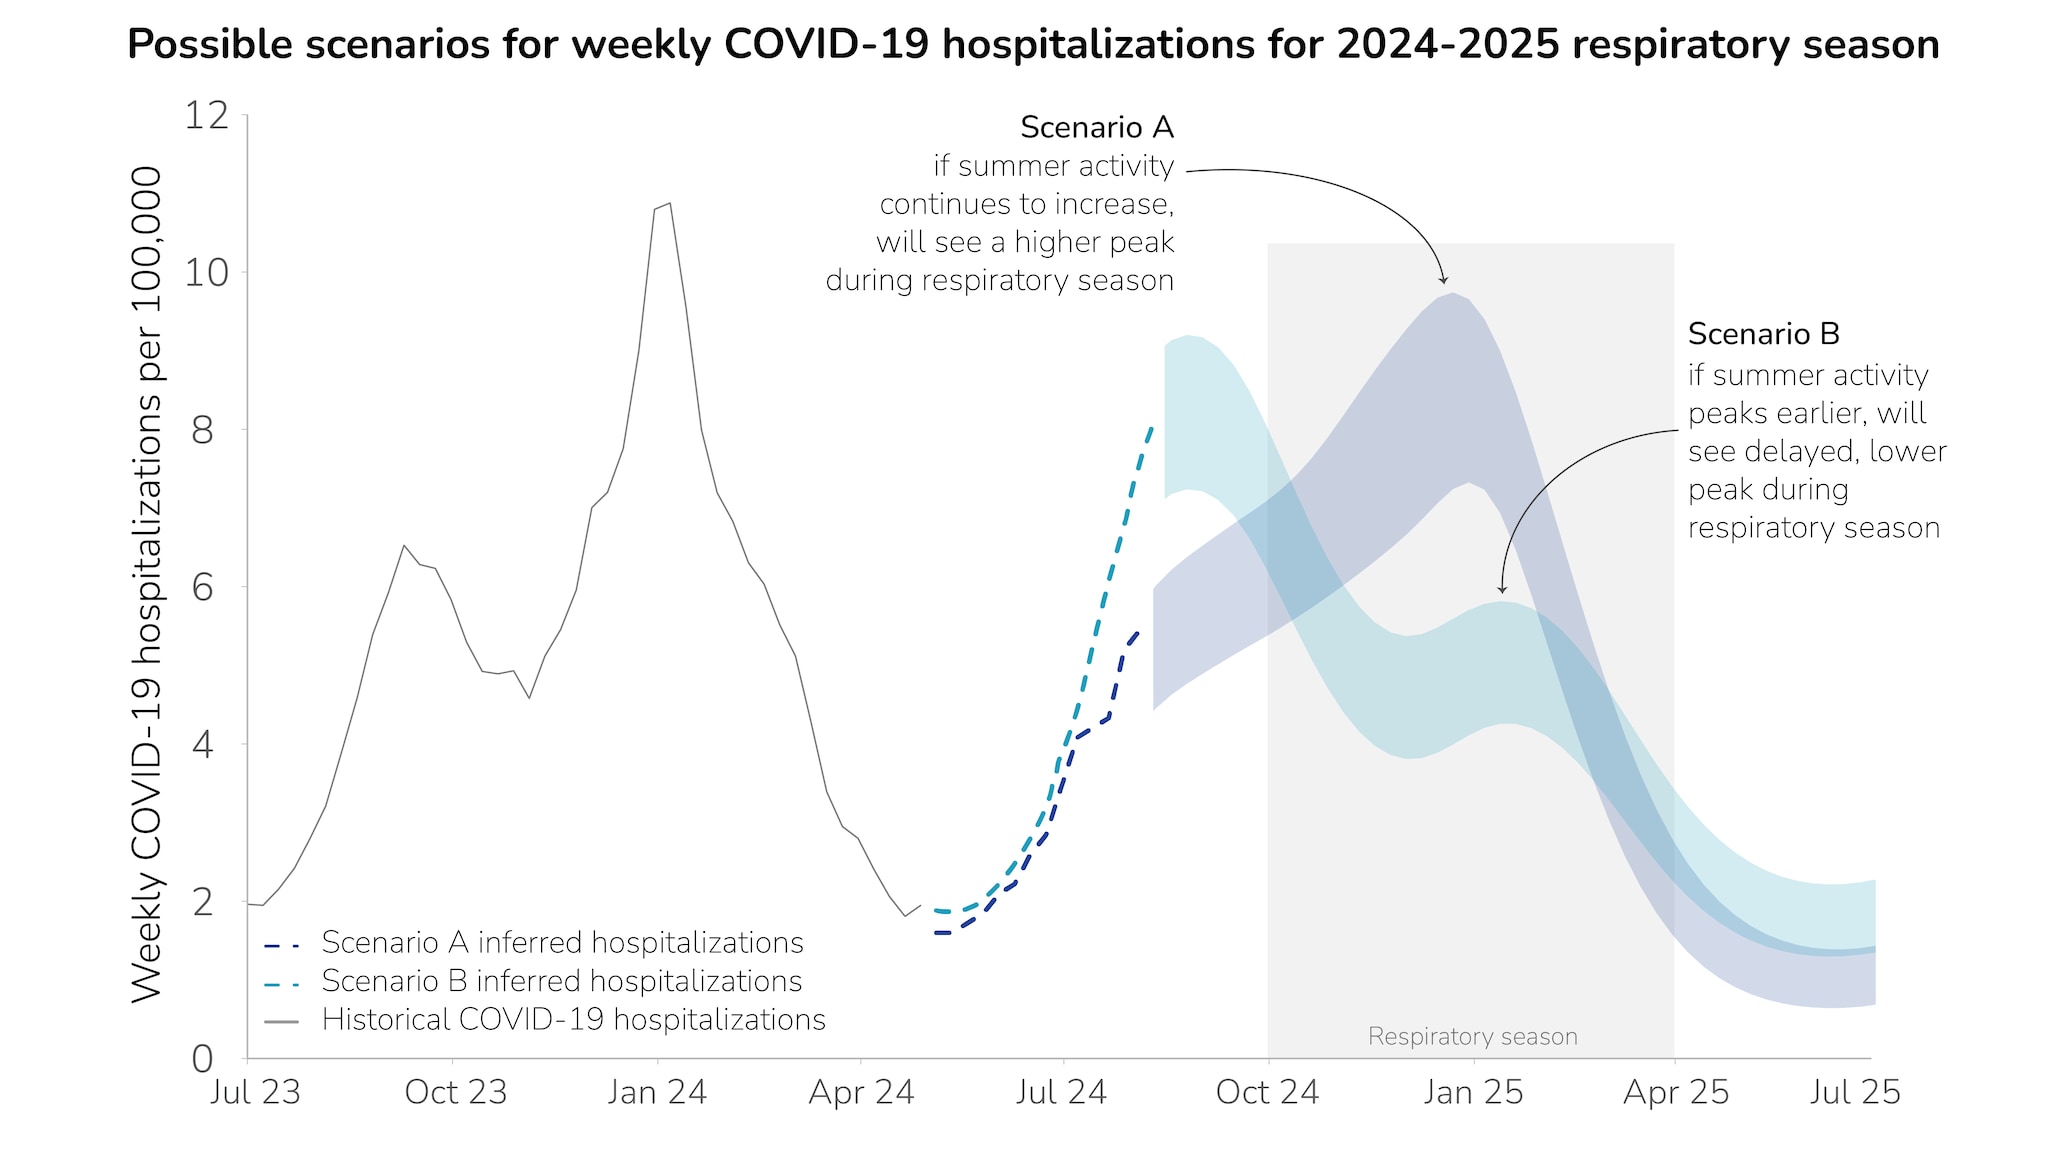
CFA led development of the 2024-2025 CDC respiratory disease season outlook to provide decision-makers information to assist with public health preparedness, including planning for potential surges in hospital demand. CDC expects the 2024-2025 fall and winter respiratory disease season will likely have a similar or lower number of combined peak hospitalizations due to COVID-19, influenza, and RSV compared to last season. See the October update to the season outlook. CDC will continue to monitor respiratory disease activity throughout the fall and winter.
How scenario modeling can inform decision-making
CFA has developed scenario modeling capability that allows decision-makers to examine a range of possible outcomes under different assumptions about the future, providing insights for addressing specific policy questions and for general preparedness and planning. Read more for an overview of how scenario modeling helped inform CFA's 2024-2025 Respiratory Disease Season Outlook.
COVID-19 Forecasts (coming soon)
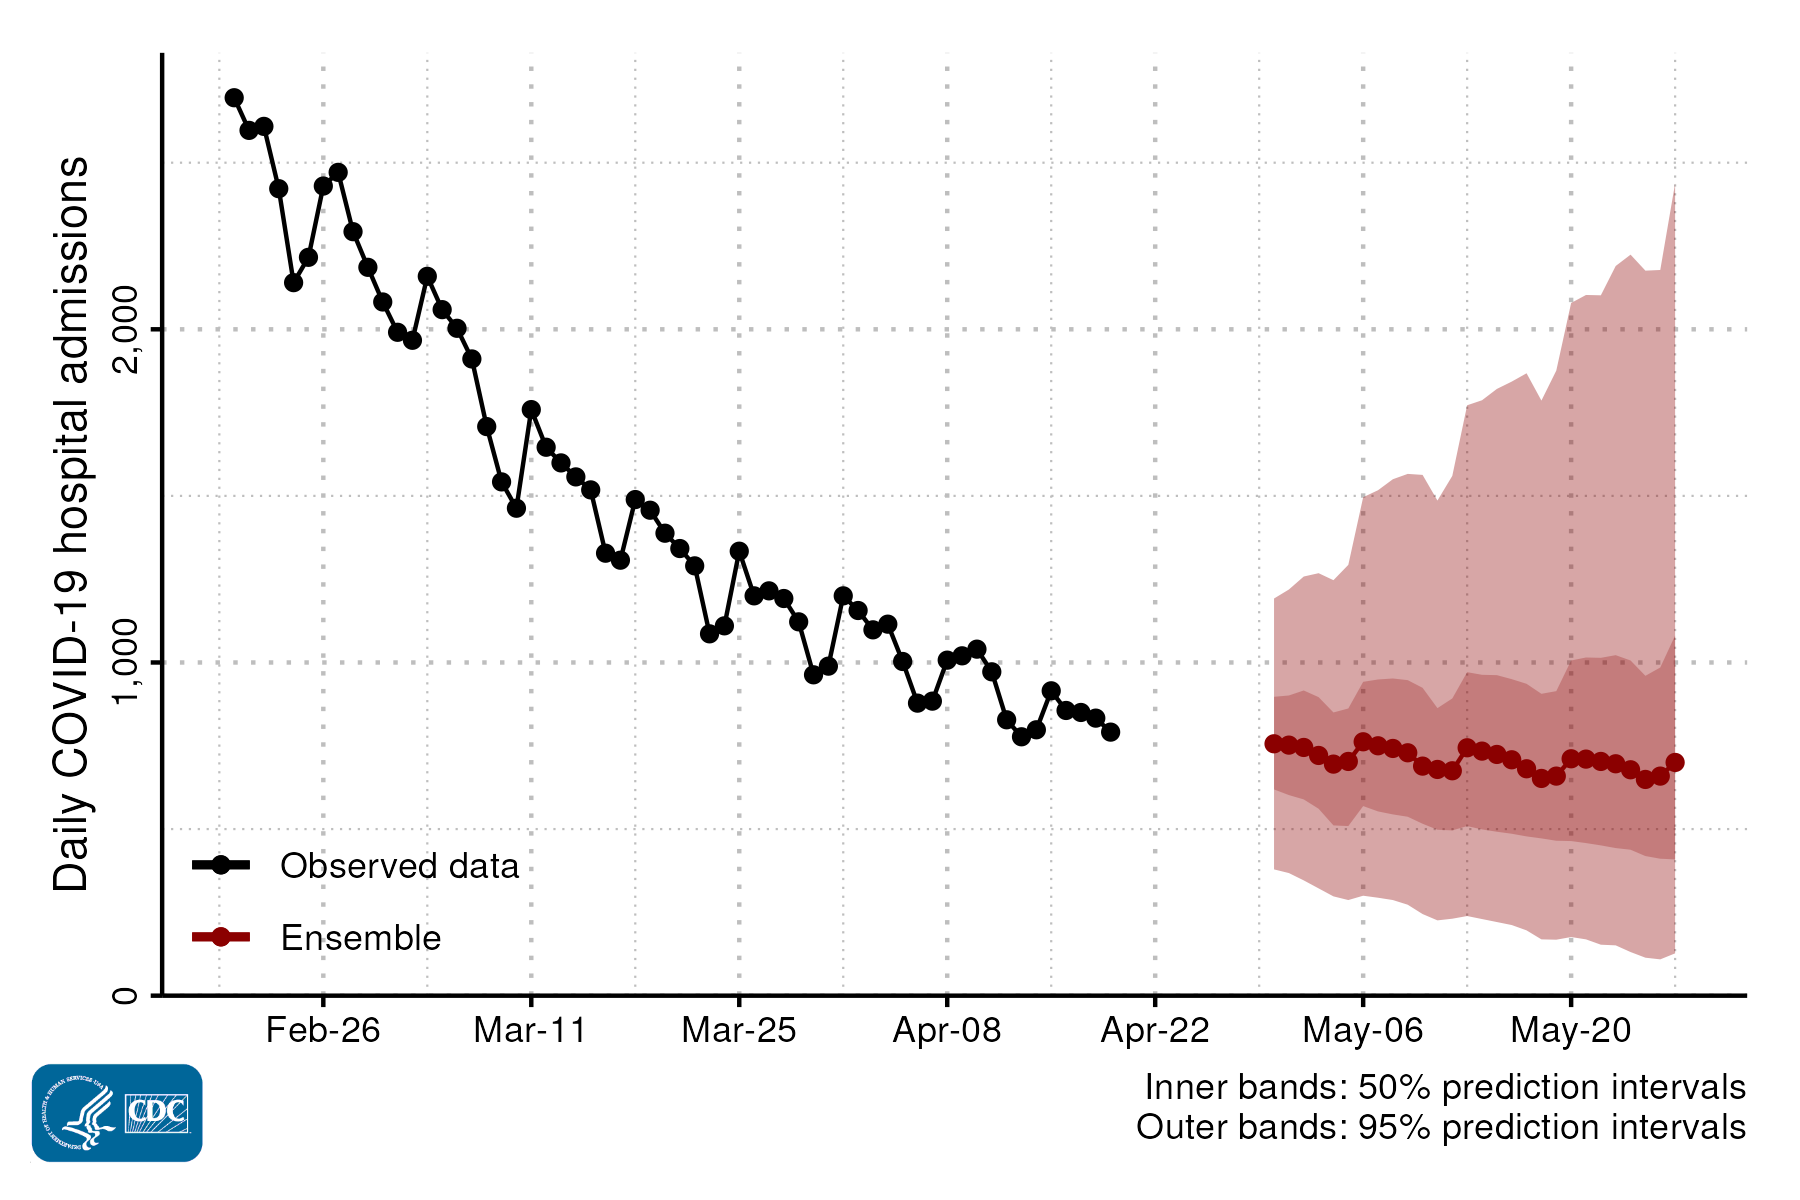
Previously, CDC has submitted short-term forecasts of COVID-19 hospital admissions to the COVID-19 Forecast Hub. The COVID-19 Forecast Hub, which is currently paused, receives forecasts from modeling teams from across the country and builds a single ensemble forecast. These ensemble forecasts for COVID-19 hospitalizations have helped public health decision-makers anticipate healthcare burden and prepare for potential COVID-19 surges. One of the forecasts CFA submitted was informed by wastewater data – read more about CFA's wastewater-informed COVID-19 hospital admission forecast. COVID-19 hospitalization forecasts are expected to resume this winter.
Respiratory Illnesses Data Channel
CFA provides forecasts and analytics to support CDC's wider preparedness efforts for respiratory virus season. Part of the wider effort includes the Respiratory Illnesses Data Channel, which provides a snapshot of COVID-19, influenza, and RSV activity in your community so that you can protect yourself and others.
