At a glance
This Behind the Model provides an overview of how scenario modeling can be used to inform specific policy questions, as well as for public health planning and preparedness. We also illustrate how scenario modeling helped inform the Center for Forecasting and Outbreak Analytics’ 2024-2025 Respiratory Season Outlook, a high-level assessment on how the season could unfold.

Scenario Modeling Overview
Disease modeling provides insights into how pathogens might spread through a population, informing preparedness and response efforts. Two types of disease modeling—forecasting and scenario modeling—attempt to capture past dynamics to illustrate how future disease dynamics might occur. While similar in approaches, scenario modeling allows us to explore longer-term hypotheticals in the form of "what if" questions, whereas forecasting focuses on shorter-term predictions and quantifying uncertainty. Because forecasting focuses on the near-term future, this approach is more useful in predicting what will happen, while scenario modeling is helpful for exploring a broader set of long-term outcomes under a range of assumptions about the future, providing insights for addressing specific policy questions and for general preparedness and planning.
Scenario Modeling to Inform Specific Policy Questions
Scenario modeling allows decision-makers to examine a range of possible outcomes under different assumptions about the future. Scenario models can examine the impact of factors that are out of our control, such as the emergence of a new variant or severity of disease, informing preparedness and situational awareness. Scenario models can also examine factors that are under our control, such as vaccination or treatment recommendations, guiding decisions about interventions and policies (Howerton et al., 2023).
COVID-19 Scenario Modeling Hub results have been used to anticipate the possible number of COVID-19 hospitalizations under a variety of potential conditions, including new viral variants and vaccine uptake, and have informed discussions around specific vaccination policies (Borchering et al., 2023). The Advisory Committee on Immunization Practices (ACIP) used the results to help guide their interim recommendations for the use of bivalent booster doses of COVID-19 vaccines in 2022. Scenarios demonstrated that increased vaccination coverage among a broader subset of the population would result in a reduction in hospitalizations and deaths from COVID-19 (Rosenblum et al., 2022) regardless of a new variant emerging. Modeling results were also used to evaluate the impact of different COVID-19 vaccine recommendations in 2023-2024 and 2024-2025.
Scenario Modeling for Planning and Preparedness
Scenario models can also inform planning and preparedness, such as evaluating how diseases might progress over several months or during a respiratory season. Below we detail how scenario models were used to help inform long-term planning for the respiratory virus season in the 2024-2025 Respiratory Disease Season Outlook.
Scenario Modeling in the 2024-2025 Respiratory Season Outlook
Every winter, the U.S. hospital system prepares for an increase of emergency department visits and hospitalizations from the three major seasonal respiratory diseases: COVID-19, influenza, and respiratory syncytial virus (RSV). COVID-19 has added substantial disease burden to the respiratory season, increasing the risk of hospital strain compared to pre-pandemic years.
To provide public health decision-makers with potential scenarios for how the season could unfold for each disease, we used two separate modeling approaches in our 2024-2025 Respiratory Disease Season Outlook. The first was a dynamic disease transmission model to examine potential hospitalization burden for COVID-19. The second was a model to estimate the number of hospitalizations that could be prevented in the upcoming season due to vaccination for influenza and RSV.
Transmission Modeling Approach
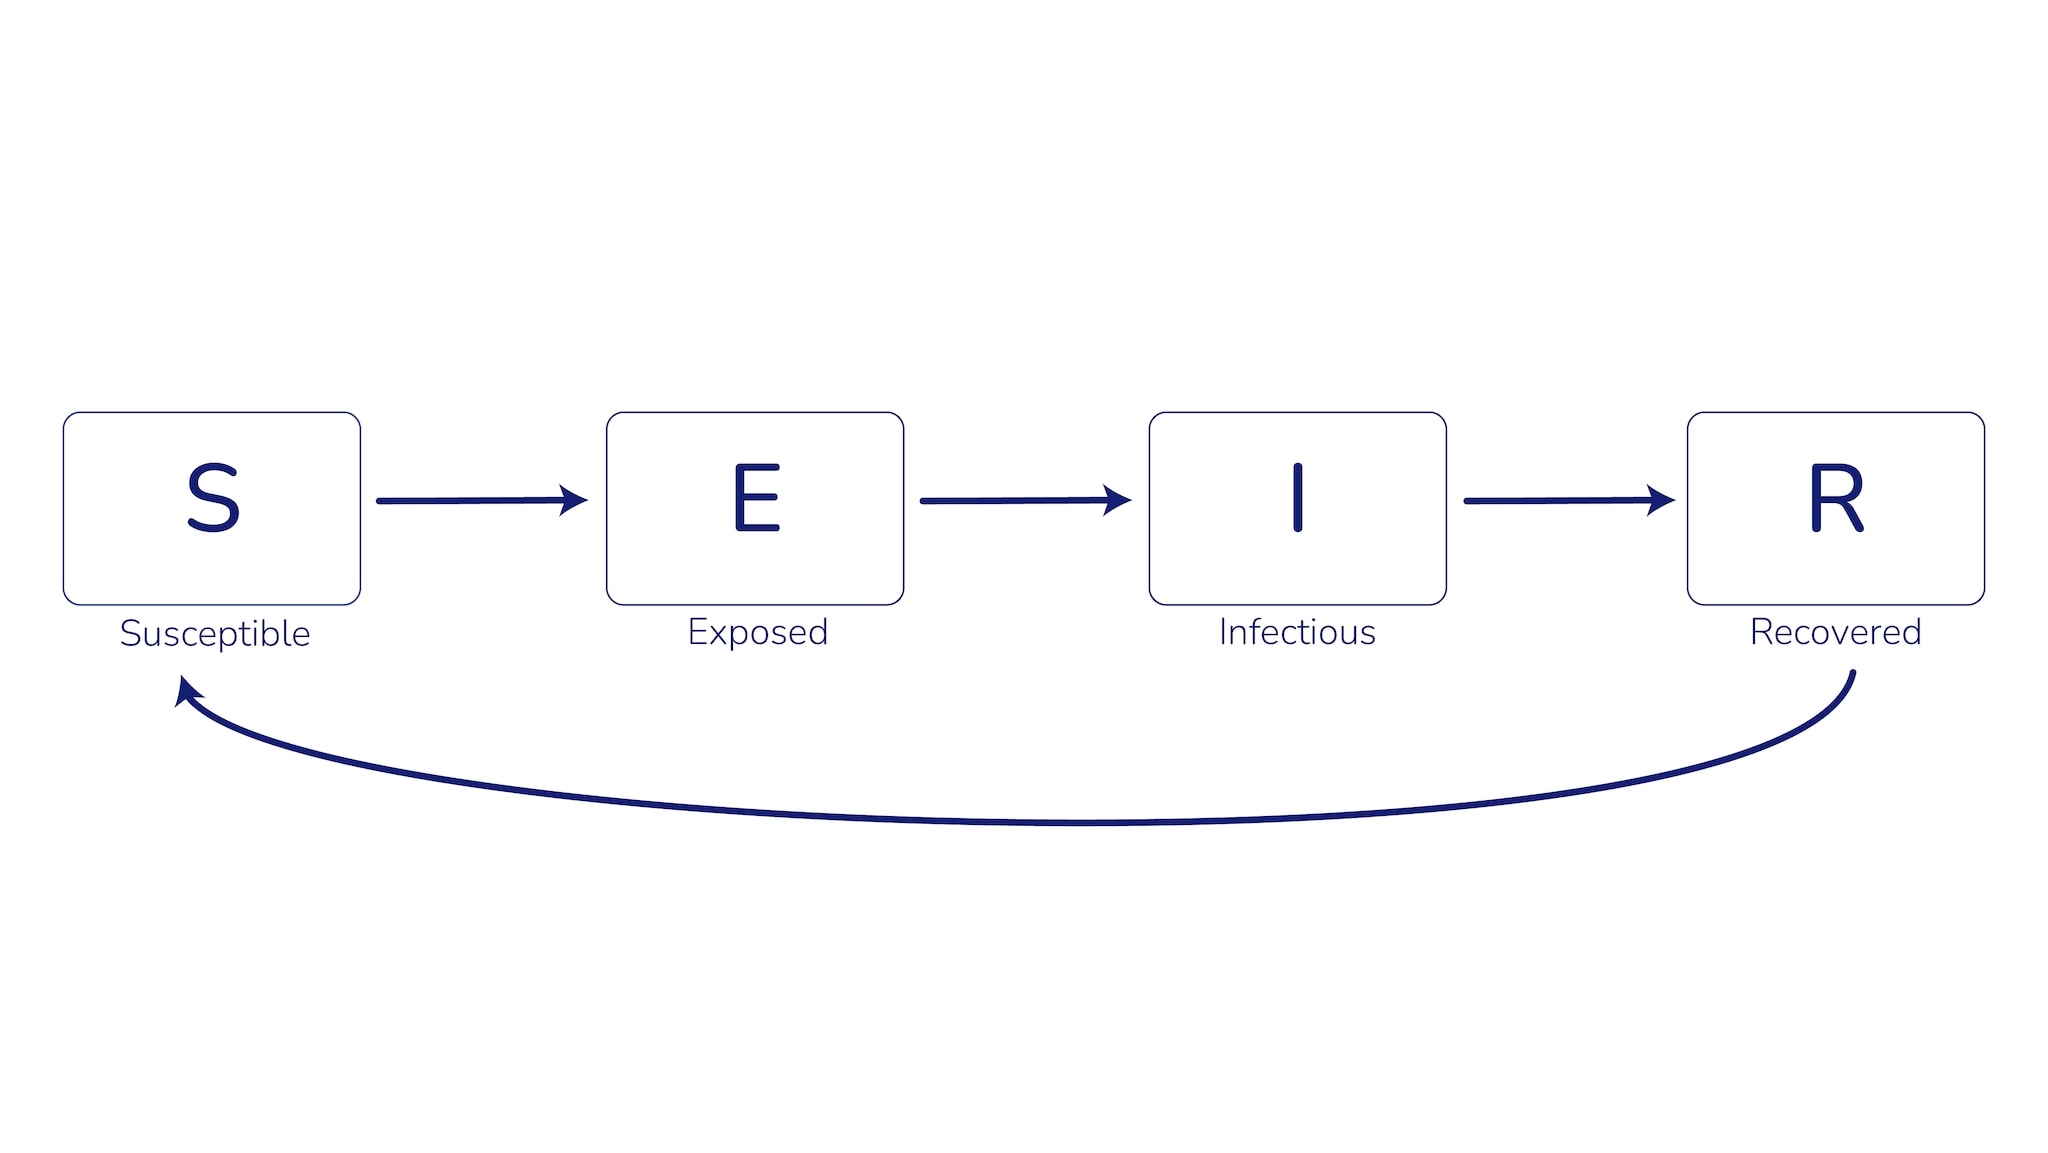
Our COVID-19 transmission model used a compartmental modeling structure, which groups the population into categories or "compartments" based on characteristics such as their age, infection history, and disease status. The model then uses mathematical equations to describe how groups move between compartments (e.g., from uninfected to infected, or from unvaccinated to vaccinated). A common example of this type of model for infectious diseases is the SEIR model, where compartments represent S: susceptible, E: exposed, I: infectious, and R: recovered (Figure 1).

Compartmental models can include more complexity—and therefore more accurately depict the real world depending on data availability—by incorporating factors such as age structure of the population, infection and vaccine history, and waning immunity. These models also incorporate both the effects of vaccination on protecting vaccinated individuals (direct effects) and reducing transmission (indirect effects). However, more complexity can increase the time needed to develop and deploy the model, increase the amount and types of data required to calibrate the model, and make the results more challenging to interpret.
Compartmental models can provide insights into questions such as, “When might weekly hospitalizations peak this winter?” To answer this question, a model requires disease-specific values, or parameters, that represent various characteristics of infection, such as transmission rates, incubation period, and duration of infectiousness. Model structures and parameters can be adjusted to create hypothetical scenarios representing public health interventions (e.g., vaccinations that increase immunity or treatments that shorten infectiousness period) or pathogen evolution (e.g., a new variant with a shorter incubation period). The modeled output from each scenario can be compared to understand how each factor affects the estimated number of weekly hospital admissions, which in turn can help with planning, preparedness, and public health decision-making.
To evaluate different COVID-19 hospitalization burden scenarios for the 2024-2025 respiratory season in the U.S., we developed a compartmental model that takes into account population age structure, previous infection, vaccination, immunity waning, and multiple variants. To improve accuracy of the model and ensure it aligned with real-world observations, we calibrated it to hospitalization, serology, and strain prevalence data for each U.S. state using Markov chain Monte Carlo (MCMC) simulations. Among other parameters, our MCMC approach estimates age- and state-specific hospitalization-per-infection rates, which we used to translate modeled infections into hospitalizations. We produced forward projections (sample size = 100) for each state and scenario, and then aggregated the state-level output to produce national projections.
At the time of publication (August 2024), there was an ongoing COVID-19 wave, which resulted in uncertainty in how the wave would impact the magnitude and timing of peak hospitalization burden for the fall/winter 2024-2025 respiratory season. While this model can be used to evaluate the impact of interventions such as vaccinations, given this uncertainty, we chose instead to focus on two scenarios of how the respiratory season might unfold. These two scenarios were modeled based on inferred hospitalization rates using National Syndromic Surveillance Program (NSSP) emergency department visits (Scenario A) and the Coronavirus Disease 2019 (COVID-19) Hospitalization Surveillance Network (COVID-NET) hospitalization data (Scenario B). We also assumed vaccine effectiveness and uptake similar to the 2023-2024 respiratory season and modeled a potential new winter variant with similar properties (innate transmission ability, immune escape relative to earlier variants, and introduction timing) as JN.1, the variant that drove the 2023-2024 winter wave.
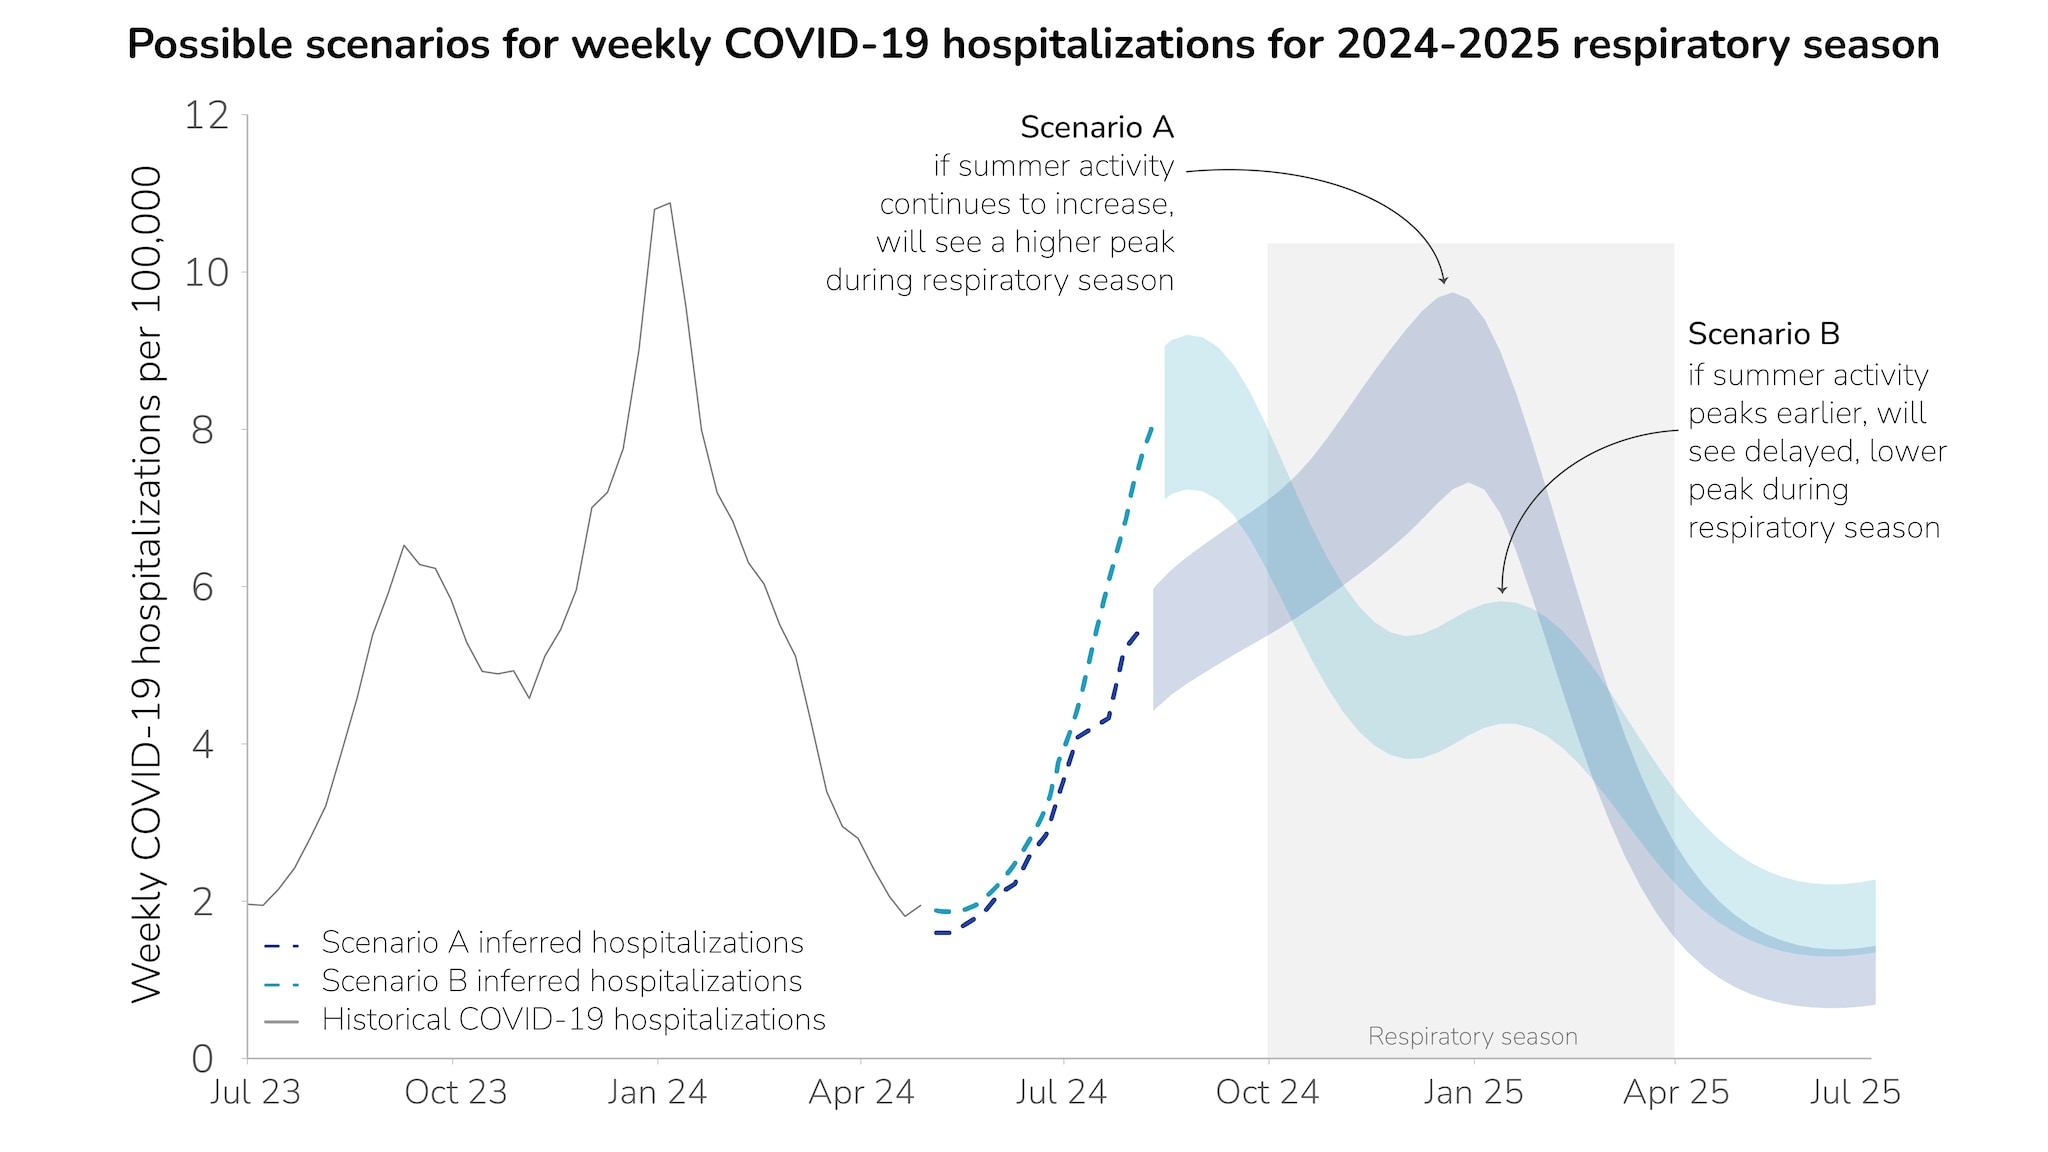
Prior to April 27, 2024, we used the National Healthcare Safety Network (NHSN) hospitalization data to characterize the national COVID-19 burden. NHSN data reporting requirements changed after April 27, 2024, necessitating that we infer hospitalization rates through other indirect data sources: NSSP nationwide emergency department visits and COVID-19 hospitalization surveillance network data (COVID-NET) from a subset of hospitals nationwide. We predicted national hospitalization rates for each of these data sources using linear regression, fitting the linear models using data from July 2022 to April 2024. We then used the fitted model to estimate hospitalizations nationwide from May 2024 to July 2024 (Figure 2).

For Scenario A, we found that if summer COVID-19 activity continues to increase into the fall and doesn’t peak before the respiratory season (October-April), the wave may peak in the range of 7.2-9.7 peak weekly hospitalizations per 100,000 during late December 2024. For Scenario B, we found that if the summer COVID-19 activity peaks before respiratory season begins, modeling results suggest that a second, smaller wave would occur mid-January 2025, with a range of 4.2-5.8 peak weekly hospitalizations per 100,000. We highlight these two example scenarios to demonstrate the range of uncertainty for how this season could unfold at a national level. In both scenarios, the peak COVID-19 hospitalization burden is lower than last year's peak.
Influenza and RSV Prevented-Burden Modeling
For influenza and RSV, we used a modeling approach that allows for estimating the effect that immunization could have on preventing hospital admissions in this coming respiratory season. This modeling approach is similar to ones used by the National Center for Immunization and Respiratory Diseases (NCIRD) Influenza Division and the COVID-19 Response to retrospectively estimate hospital admissions prevented by vaccination (Reed et al. EID 2009; Steele et al., 2022,Tokars et al., 2018,Rolfes et al., 2019).
The model assumes that immunization protects those who are vaccinated against severe outcomes (direct effects) but does not prevent disease transmission (indirect effects). This simplification means that the model underestimates the value of immunization, but it also means that a relatively simple calculation can be used to estimate the number of hospital admissions prevented by vaccination. This approach uses fewer parameters and requires fewer data inputs than the dynamic transmission models described above.
In a hypothetical example of a single immunization event in a fixed population, this calculation reduces to:
Burden with immunization = Burden without immunization * (1 - coverage * effectiveness)
To develop a baseline projection of next season’s burden, we first used RSV and influenza hospitalization data from last season, adjusting for the fact that not everyone hospitalized because of influenza or RSV has received a positive test. Next, we use the above equation to infer the number of hospitalizations that would occur next season if no one is immunized. Finally, we reverse the calculation to estimate the number of hospitalizations that would occur under certain assumptions about future immunization coverage and effectiveness. The prevented burden is estimated as the difference between the counterfactual, no-immunization burden and the observed burden.
We used this method to generate a hypothetical hospital admission time course for several influenza and RSV scenarios.
Immunizations assessed include the seasonal influenza vaccine, the RSV vaccines for older adults (Arexvy, Abrysvo, mRESVIA), the RSV immunization for infants and young children (nirsevimab), and the RSV vaccine for pregnant persons to protect their infants (Abrysvo). We developed scenarios for 2024-2025 using aggregate estimates from the expert elicitation process for effectiveness and uptake of all immunizations.A Select modeling results from this approach were included in the Respiratory Disease Season Outlook to help assess how the season might play out. Modeling results showed that prevented hospitalizations for flu and RSV varied across scenarios.
Of note, our work is prospective and illustrates a limited set of possible futures to inform planning and preparedness activities. These scenarios provide insight into how the season may unfold, and the actual 2024-2025 season may differ substantially from these scenarios.
Conclusions
In conclusion, scenario modeling allows us to examine how disease transmission dynamics may fluctuate depending on different circumstances and explore how long-term hypothetical scenarios may occur over the course of a season. Scenario modeling has informed vaccination policy and enabled planning and preparedness. Both the compartmental modeling as well as the vaccine-prevented burden modeling approaches have their advantages and disadvantages, with both approaches offering insight for decision-making and planning for the 2024-2025 Respiratory Disease Season Outlook.
- The respiratory outlook incorporates expert opinion from 19 subject-matter experts specializing in COVID-19, influenza, and RSV epidemiology, infectious disease modeling, disease surveillance, and risk assessment methods. In partnership with Metaculus, CDC designed a questionnaire and process for soliciting views from experts on the upcoming fall and winter respiratory season. Experts each answered a series of questions on the expected hospitalization burden posed by each disease, as well as on key drivers for a season with a higher peak hospitalization rate. After experts submitted initial responses to the questionnaire, CDC and Metaculus convened a workshop to discuss results and any key areas of disagreement. Experts were then allowed to update their responses, if desired. The final results were used to inform this Respiratory Disease Season Outlook and as inputs into scenario modeling.
