Purpose
- Web series sharing the behind-the-scenes work of Center for Forecasting and Outbreak Analytics (CFA) and partners in generating models, forecasts, and other analytic products.
- Aim to provide a high-level overview of methods and practical applications of our work.
- Written for public health practitioners, healthcare providers, and the public.
Spotlight Recent Work
Did you see?
Behind the Model: How scenario modeling can inform decision-making
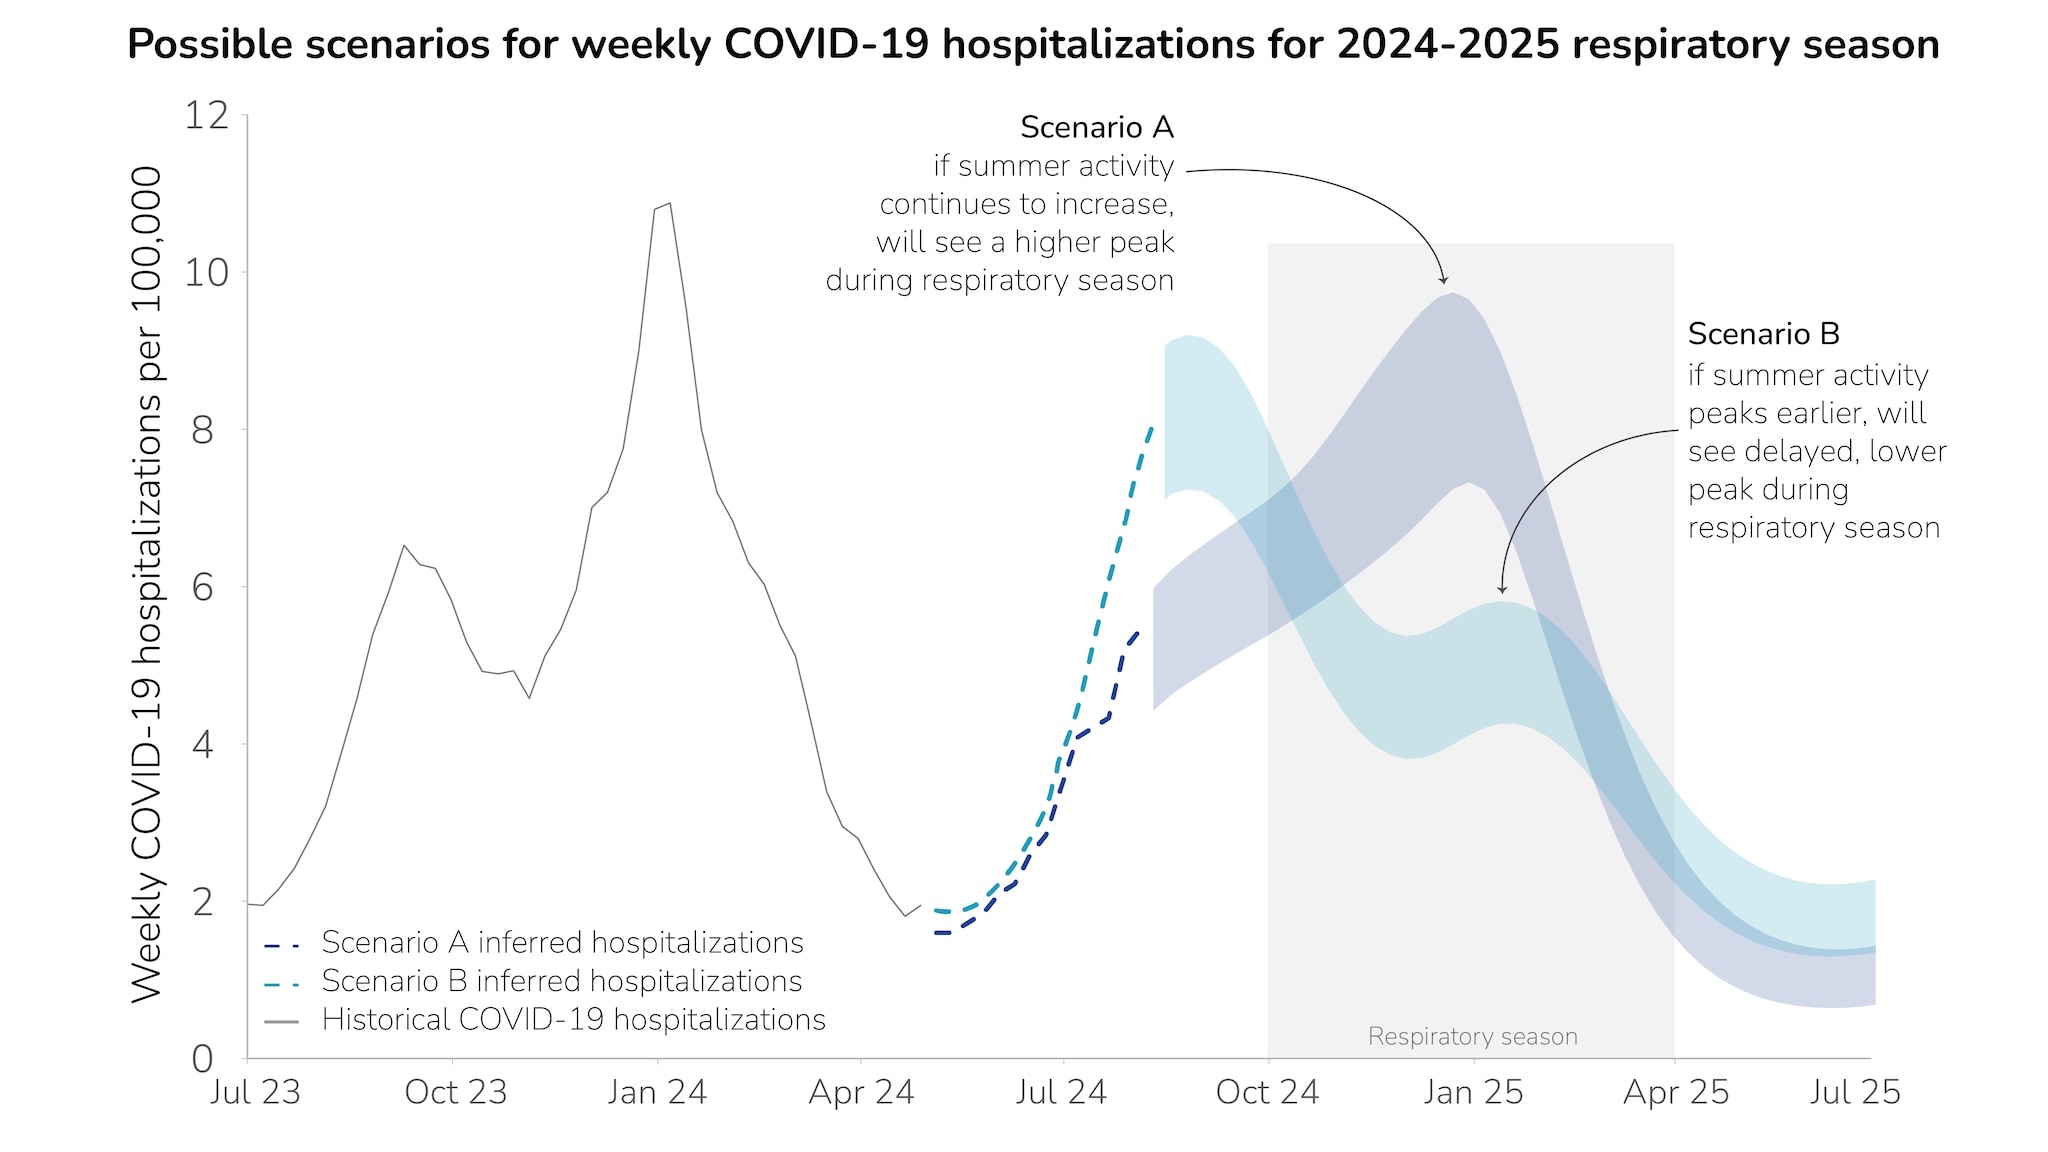
CFA has developed scenario modeling capability that allows decision-makers to examine a range of possible outcomes under different assumptions about the future, providing insights for addressing specific policy questions and for general preparedness and planning. Read more for an overview of how scenario modeling helped inform CFA’s 2024-2025 Respiratory Season Outlook.
Supporting Decision-Making in a Local Measles Response
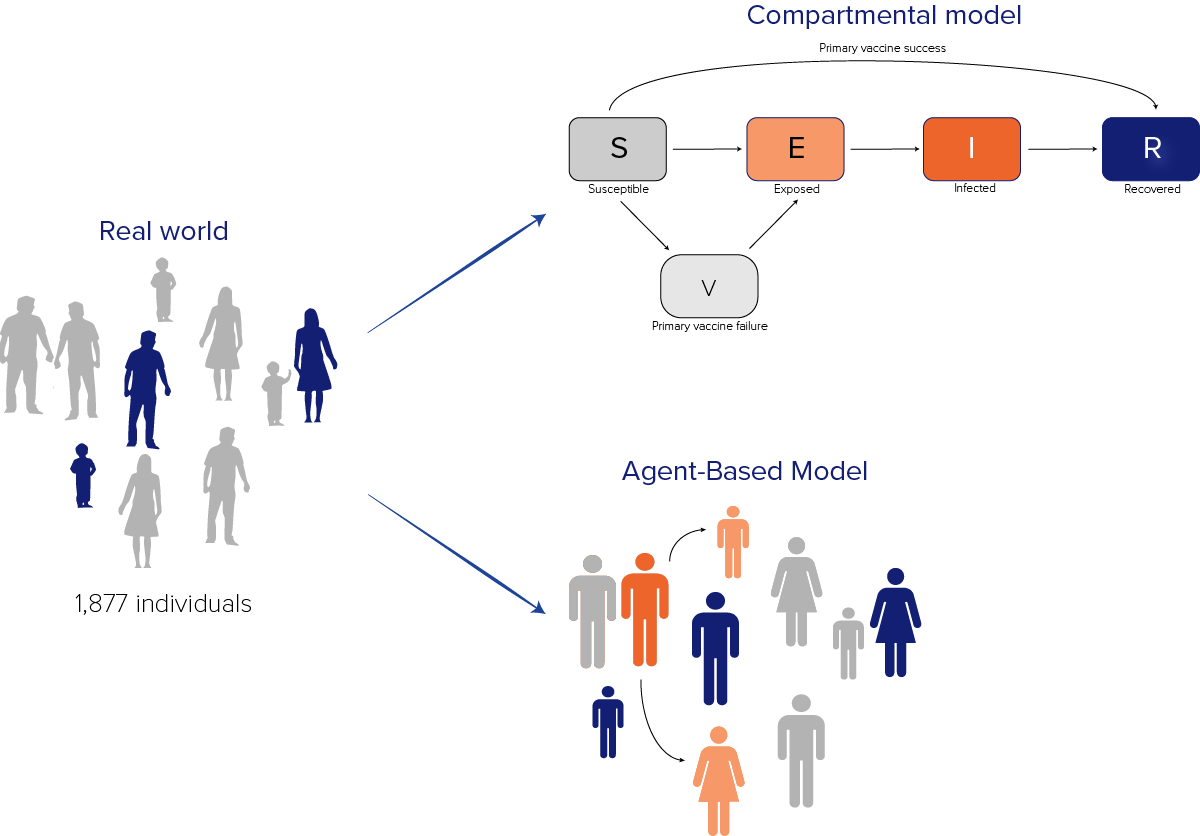
CFA is building modeling tools that can be used in real-time to support decision-making for outbreak response. In March 2024, CDC’s National Center for Immunization and Respiratory Diseases (NCIRD) and CFA worked together to support the response by the Chicago and Illinois Departments of Public Health to a measles outbreak. The models helped forecast the expected size and duration of the outbreak and helped the Chicago Department of Public Health plan the public health response, allocate resources, and evaluate the impact of public health measures.
Improving CDC’s Tools for Assessing Epidemic Trends
CFA is building modeling tools and computational pipelines so that we can analyze data quickly and accurately in response to outbreaks. Our goal is to make these tools accessible to federal, state, tribal, territorial, local, and academic partners. One of these efforts is to estimate the time-varying reproductive number, Rt, a measure that helps us quickly assess whether infections are increasing or decreasing.
Estimating Impact of Updated Isolation Guidance
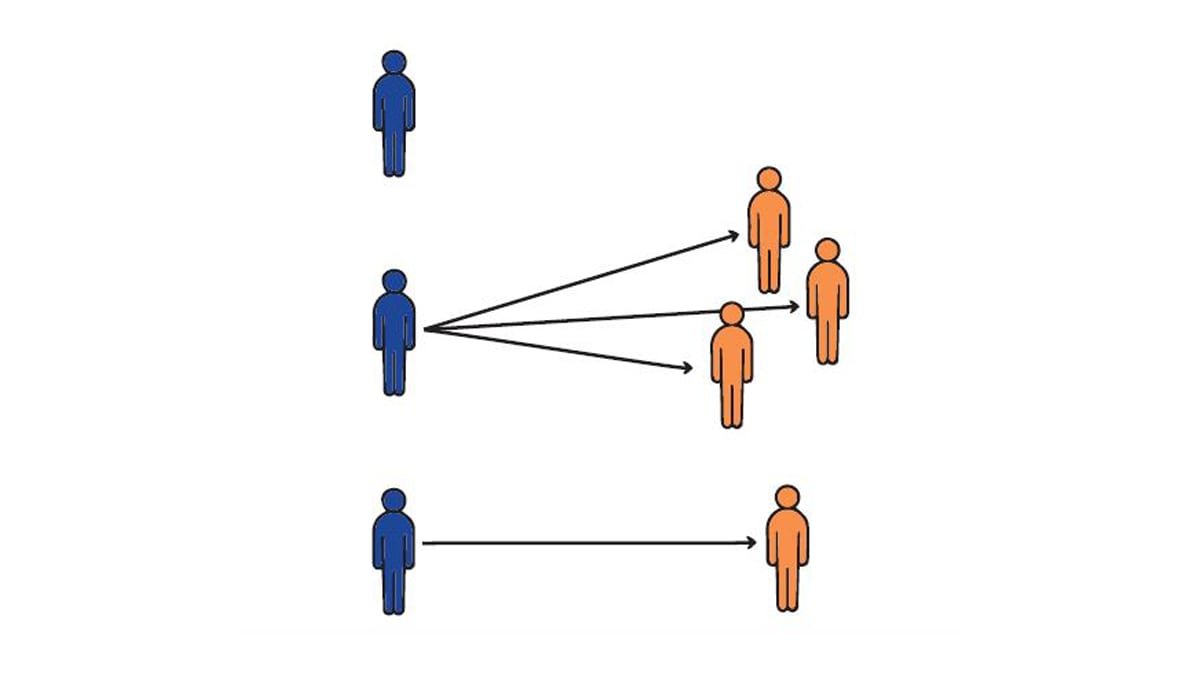
We estimated the potential impact of CDC’s updated respiratory virus isolation guidance on an individual’s COVID-19 transmission potential. Our analysis found little difference on average for the likelihood that someone with COVID-19 would spread it to others under the updated isolation guidance compared with the previous guidance.
Wastewater-Informed Forecasting
CFA is building public health modeling tools that use signal fusion, in which data streams from multiple sources are used to produce more accurate modeling and analytics. In one example of this work, we are partnering with the National Wastewater Surveillance System (NWSS) and the National Center for Immunization and Respiratory Diseases (NCIRD) to use wastewater data alongside hospital admissions data to forecast COVID-19 hospital admissions at the state and national levels. These additional data could improve forecasts at critical times, such as when entering a surge in transmission.
