What to know
ESSENCE is the key tool that allows public health professionals to access and interpret the data that flow into the BioSense Platform. This supports collaboration and investigation. It also allows users to analyze, visualize, and share data. ESSENCE is also known as the Electronic Surveillance System for the Early Notification of Community-based Epidemics.

Training
Harnessing free-text queries in ESSENCE can help analysts and epidemiologists rapidly respond to outbreaks, disasters, and events. Key resources include:
- Free-Text Coding in ESSENCE, a seven-part series
- Query Development Job Aid
The ESSENCE Online Training Course is available, along with additional ESSENCE courses, through the NSSP Community of Practice Knowledge Repository.
- NSSP ESSENCE 101 Training, 2021 in Vimeo
- NSSP ESSENCE 101 Training, 2020 in Vimeo
The Rnssp R package facilitates access to ESSENCE via a secure and simple interface, with methods that streamline the data pull. Please find Rnssp R training resources here: Posit Workbench and SAS Studio.
FAQs
In ESSENCE, ZIP codes are used for Patient Location (Region). ESSENCE Regions are aggregations of data from the ZIP codes with centroids within the county or territory border.
The Patient_Zip starts as a direct input from the HL7®1 message. The first five digits of the Patient_Zip are sent to the ZipCode field.
When invalid, blank, or null values are sent, the Patient Region is categorized as OTHER_REGION. This category is selectable by going to the ESSENCE Query Portal, under the Patient Region, and then selecting the Patient Location (Full Details) data source. Any patient with an invalid ZIP code is grouped under OTHER_REGION by Patient HHS Region and by Patient State before grouped as OTHER under the Patient Zipcode List.
A patient with an invalid ZIP code will not be grouped under strata for Patient Core-based Statistical Area, Metropolitan Statistical Area, or Patient County Federal Information Processing Standards (FIPS) approximation. If you attempt to stratify or query by these strata, the results will exclude visits and show blank, null, and invalid ZIP codes.
An application programming interface, or API, helps machines or applications exchange information in a manner that is structured and consistent. That's why APIs are ideal for generating reports published at regular intervals from the same data source (ESSENCE). Examples include daily situational reports and weekly or monthly bulletins. Plus, you can pull data from ESSENCE in various formats: aggregated tables, counts, proportions across various stratifications, etc.
You can tailor findings to different formats of your choosing to suit your audiences. For example, you can use APIs to share trends by syndrome with other analysts. Or create reports for public health officials that compare weekly visits for opioid overdose trends. APIs can efficiently combine information from ESSENCE and other data sources in one report. You can also create infographics for nontechnical audiences (38% of hospitals in region X show X).
Public health surveillance is all about gathering and sharing data to inform decision-making. Epidemiologists work hard to make sense of messy syndromic data and present it in ways that are meaningful and actionable. Once you've honed the approach you want to use in a report, use the API to update the data used in your charts and tables. You'll experience a boost in productivity (and accuracy) once you programmatically incorporate an API into your analysis.
Find more information about APIs in ESSENCE.
An API is a structured and consistent way for one machine (or application) to exchange information with another machine or application. One machine will make an API request (URL with query parameters and display format) and the other will respond. An API response (the information returned to the requestor) using the ESSENCE APIs is either a table of data or a time series image.
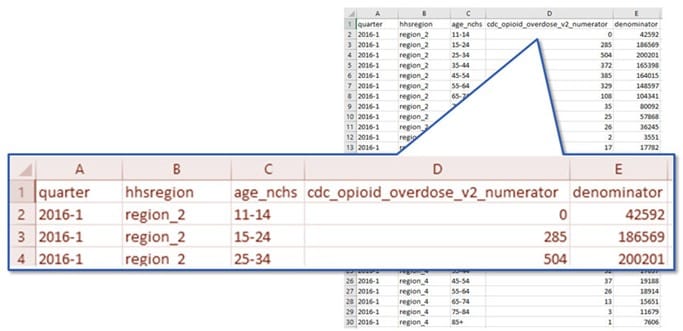
The most common API response is a table. In this example, Table Builder provided output in CSV format (JSON is an option, too). Shown below is a table of counts for a particular Chief Complaint (CC) and Discharge Diagnosis (DD) category by quarter, HHS Region, and National Center for Health Statistics age group. Here, we have sent a request to ESSENCE to summarize certain information for us and then return aggregate results. You can automate this query to update over time and then further summarize or visualize it in whatever way suits your needs.

Articles
Advantages of Designating Associated Facilities
Using ESSENCE to Monitor Changes in Data Quality
The Case of the Disappearing Diagnosis
BioSense Platform Creates an Identifier Unique to Each Visit
Keeping Records out of the Filtered Zone in BioSense Platform
Oh My ...You Haven't Aged a Bit!
Find more ESSENCE guidance in our library of Helpful Articles.
- HL7® and FHIR® are the registered trademarks of Health Level Seven International, and their use of these trademarks does not constitute an endorsement by HL7.


