Reported Tuberculosis in the United States, 2021
Table 28. Tuberculosis Risk Factors by Origin of Birth1 and Hispanic Ethnicity and Non-Hispanic Race:2 United States, 2021
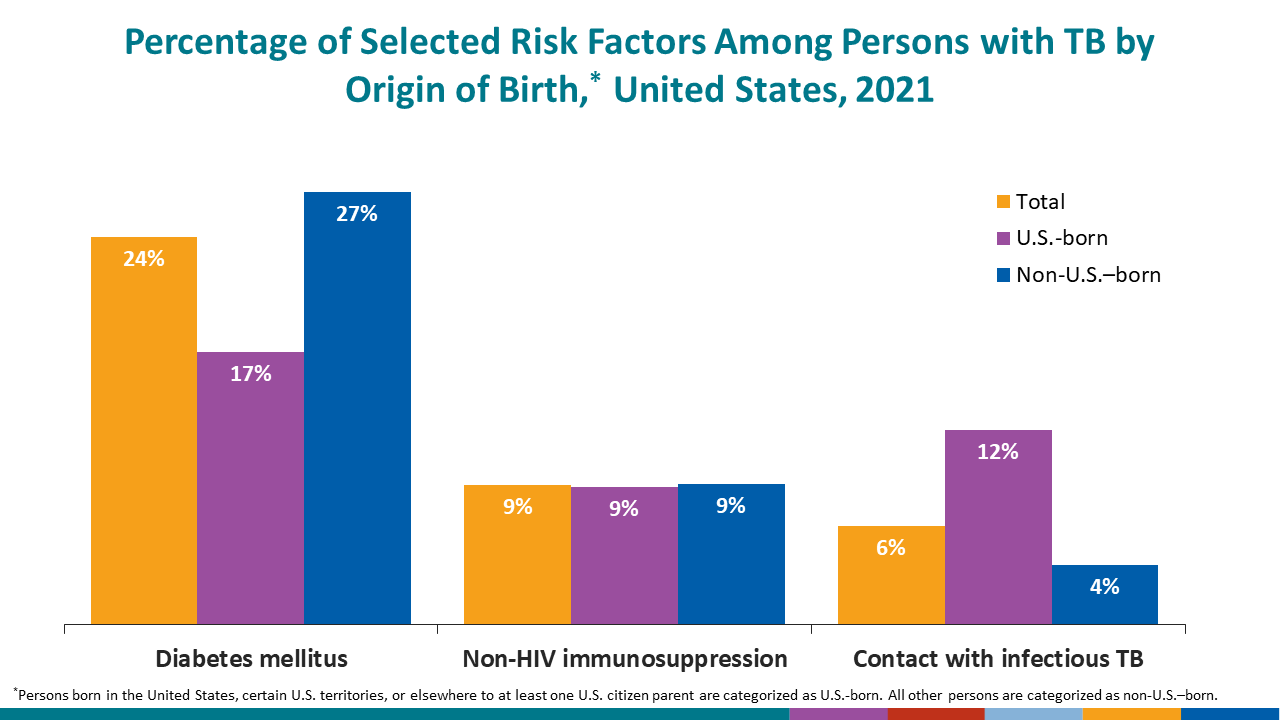
See Surveillance Slide #51
| Total cases3 | Contact4 | Non-HIV immunosuppression5,6 | Diabetes mellitus | Post-organ transplantation | TNF-α inhibitors7 | Other8 | None | Unknown | |||||||||
|---|---|---|---|---|---|---|---|---|---|---|---|---|---|---|---|---|---|
| No. | (%) | No. | (%) | No. | (%) | No. | (%) | No. | (%) | No. | (%) | No. | (%) | No. | (%) | ||
| United States | 7,849 | 475 | (6.1) | 678 | (8.6) | 1,875 | (23.9) | 52 | (0.7) | 82 | (1) | 1,953 | (24.9) | 2,855 | (36.4) | 989 | (12.6) |
| U.S.-born | |||||||||||||||||
| Total | 2,223 | 267 | (12) | 189 | (8.5) | 374 | (16.8) | 15 | (0.7) | 26 | (1.2) | 638 | (28.7) | 717 | (32.3) | 333 | (15) |
| American Indian or Alaska Native | 86 | 25 | (29.1) | 2 | (2.3) | 19 | (22.1) | 0 | 0 | 0 | 0 | 30 | (34.9) | 23 | (26.7) | 5 | (5.8) |
| Asian | 124 | 22 | (17.7) | 5 | (4) | 11 | (8.9) | 0 | 0 | 1 | (0.8) | 27 | (21.8) | 45 | (36.3) | 24 | (19.4) |
| Black or African American | 758 | 92 | (12.1) | 74 | (9.8) | 138 | (18.2) | 3 | (0.4) | 4 | (0.5) | 221 | (29.2) | 237 | (31.3) | 116 | (15.3) |
| Hispanic or Latino | 543 | 70 | (12.9) | 29 | (5.3) | 84 | (15.5) | 1 | (0.2) | 5 | (0.9) | 125 | (23) | 229 | (42.2) | 62 | (11.4) |
| Multiple race | 22 | 2 | (9.1) | 0 | 0 | 3 | (13.6) | 0 | 0 | 0 | 0 | 6 | (27.3) | 7 | (31.8) | 5 | (22.7) |
| Native Hawaiian or Other Pacific Islander | 44 | 12 | (27.3) | 0 | 0 | 7 | (15.9) | 0 | 0 | 0 | 0 | 2 | (4.5) | 7 | (15.9) | 16 | (36.4) |
| White | 639 | 42 | (6.6) | 78 | (12.2) | 111 | (17.4) | 11 | (1.7) | 16 | (2.5) | 225 | (35.2) | 168 | (26.3) | 104 | (16.3) |
| Unknown or missing | 7 | 2 | (28.6) | 1 | (14.3) | 1 | (14.3) | 0 | 0 | 0 | 0 | 2 | (28.6) | 1 | (14.3) | 1 | (14.3) |
| Non-U.S.–born | |||||||||||||||||
| Total | 5,626 | 208 | (3.7) | 489 | (8.7) | 1,501 | (26.7) | 37 | (0.7) | 56 | (1) | 1,315 | (23.4) | 2,138 | (38) | 656 | (11.7) |
| American Indian or Alaska Native | 1 | 0 | 0 | 0 | 0 | 0 | 0 | 0 | 0 | 0 | 0 | 1 | (100) | 0 | 0 | 0 | 0 |
| Asian | 2,706 | 86 | (3.2) | 277 | (10.2) | 782 | (28.9) | 22 | (0.8) | 32 | (1.2) | 663 | (24.5) | 1,013 | (37.4) | 250 | (9.2) |
| Black or African American | 662 | 21 | (3.2) | 39 | (5.9) | 74 | (11.2) | 4 | (0.6) | 4 | (0.6) | 135 | (20.4) | 318 | (48) | 118 | (17.8) |
| Hispanic or Latino | 1,845 | 77 | (4.2) | 131 | (7.1) | 539 | (29.2) | 7 | (0.4) | 15 | (0.8) | 397 | (21.5) | 682 | (37) | 231 | (12.5) |
| Multiple race | 57 | 3 | (5.3) | 6 | (10.5) | 17 | (29.8) | 0 | 0 | 0 | 0 | 23 | (40.4) | 19 | (33.3) | 2 | (3.5) |
| Native Hawaiian or Other Pacific Islander | 71 | 14 | (19.7) | 6 | (8.5) | 28 | (39.4) | 0 | 0 | 0 | 0 | 18 | (25.4) | 12 | (16.9) | 14 | (19.7) |
| White | 241 | 2 | (0.8) | 28 | (11.6) | 53 | (22) | 3 | (1.2) | 4 | (1.7) | 66 | (27.4) | 75 | (31.1) | 37 | (15.4) |
| Unknown or missing | 43 | 5 | (11.6) | 2 | (4.7) | 8 | (18.6) | 1 | (2.3) | 1 | (2.3) | 12 | (27.9) | 19 | (44.2) | 4 | (9.3) |
1Persons born in the United States, certain U.S. territories, or elsewhere to at least one U.S. citizen parent are categorized as U.S.-born. All other persons are categorized as non-U.S.–born.
2Persons who identified as Hispanic or Latino were categorized as “Hispanic or Latino,” regardless of self-reported race. Persons who did not identify as Hispanic or Latino were categorized by self-reported race; if more than one race was reported, the person was categorized as “Multiple race.”
3Excludes persons for whom origin of birth is unknown. One person might have more than one risk factor, therefore the total number of risk factors is greater than the number of cases.
4Includes risk factor responses of “Contact with MDR-TB patient,” “Contact of infectious TB patient,” and “Missed contact.”
5HIV, human immunodeficiency virus.
6Includes risk factor responses of “End-stage renal disease” and “Immunosuppression (not HIV/AIDS).”
7TNF, tumor necrosis factor.
8Includes risk factor responses of “Incomplete LTBI therapy” and “Other.”