Reported Tuberculosis in the United States, 2019
Table 12. Tuberculosis Cases and Percentages, by Reason Tuberculosis Therapy Was Stopped: United States, 1993–2017
See Surveillance Slides #40
| Year | Total Cases 1 | Completed Therapy | Adverse event | Moved 2 | Lost | Refused | Died 3 | Unknown 4 | |||||||
|---|---|---|---|---|---|---|---|---|---|---|---|---|---|---|---|
| No. | No. | (%) | No. | (%) | No. | (%) | No. | (%) | No. | (%) | No. | (%) | No. | (%) | |
| 1993 | 23,742 | 18,043 | (76.0) | 0 | (0.0) | 1,120 | (4.7) | 1,086 | (4.6) | 223 | (0.9) | 3,053 | (12.9) | 217 | (0.9) |
| 1994 | 23,053 | 17,764 | (77.1) | 0 | (0.0) | 1,194 | (5.2) | 740 | (3.2) | 183 | (0.8) | 2,743 | (11.9) | 429 | (1.9) |
| 1995 | 21,706 | 17,306 | (79.7) | 0 | (0.0) | 969 | (4.5) | 570 | (2.6) | 155 | (0.7) | 2,396 | (11.0) | 310 | (1.4) |
| 1996 | 20,297 | 16,528 | (81.4) | 0 | (0.0) | 783 | (3.9) | 525 | (2.6) | 156 | (0.8) | 1,998 | (9.8) | 307 | (1.5) |
| 1997 | 18,932 | 15,673 | (82.8) | 0 | (0.0) | 667 | (3.5) | 444 | (2.3) | 119 | (0.6) | 1,755 | (9.3) | 274 | (1.4) |
| 1998 | 17,583 | 14,766 | (84.0) | 0 | (0.0) | 533 | (3.0) | 411 | (2.3) | 104 | (0.6) | 1,579 | (9.0) | 190 | (1.1) |
| 1999 | 16,860 | 14,233 | (84.4) | 0 | (0.0) | 456 | (2.7) | 359 | (2.1) | 104 | (0.6) | 1,437 | (8.5) | 271 | (1.6) |
| 2000 | 15,784 | 13,407 | (84.9) | 0 | (0.0) | 406 | (2.6) | 397 | (2.5) | 112 | (0.7) | 1,294 | (8.2) | 168 | (1.1) |
| 2001 | 15,411 | 13,242 | (85.9) | 0 | (0.0) | 378 | (2.5) | 402 | (2.6) | 99 | (0.6) | 1,122 | (7.3) | 168 | (1.1) |
| 2002 | 14,568 | 12,483 | (85.7) | 0 | (0.0) | 336 | (2.3) | 412 | (2.8) | 87 | (0.6) | 1,080 | (7.4) | 170 | (1.2) |
| 2003 | 14,380 | 12,418 | (86.4) | 0 | (0.0) | 313 | (2.2) | 390 | (2.7) | 84 | (0.6) | 994 | (6.9) | 181 | (1.3) |
| 2004 | 14,082 | 12,117 | (86.0) | 0 | (0.0) | 337 | (2.4) | 370 | (2.6) | 82 | (0.6) | 975 | (6.9) | 201 | (1.4) |
| 2005 | 13,674 | 11,724 | (85.7) | 1 | (0.0) | 323 | (2.4) | 340 | (2.5) | 90 | (0.7) | 986 | (7.2) | 210 | (1.5) |
| 2006 | 13,319 | 11,540 | (86.6) | 0 | (0.0) | 292 | (2.2) | 359 | (2.7) | 79 | (0.6) | 939 | (7.1) | 110 | (0.8) |
| 2007 | 12,912 | 11,344 | (87.9) | 0 | (0.0) | 241 | (1.9) | 327 | (2.5) | 72 | (0.6) | 818 | (6.3) | 110 | (0.9) |
| 2008 | 12,551 | 10,882 | (86.7) | 7 | (0.1) | 255 | (2.0) | 329 | (2.6) | 77 | (0.6) | 843 | (6.7) | 158 | (1.3) |
| 2009 | 11,168 | 9,816 | (87.9) | 22 | (0.2) | 96 | (0.9) | 165 | (1.5) | 82 | (0.7) | 681 | (6.1) | 306 | (2.7) |
| 2010 | 10,758 | 9,471 | (88.0) | 31 | (0.3) | 0 | (0.0) | 161 | (1.5) | 62 | (0.6) | 656 | (6.1) | 377 | (3.5) |
| 2011 | 10,184 | 8,973 | (88.1) | 27 | (0.3) | 0 | (0.0) | 126 | (1.2) | 69 | (0.7) | 686 | (6.7) | 303 | (3.0) |
| 2012 | 9,662 | 8,512 | (88.1) | 31 | (0.3) | 0 | (0.0) | 123 | (1.3) | 58 | (0.6) | 609 | (6.3) | 329 | (3.4) |
| 2013 | 9,272 | 8,176 | (88.2) | 39 | (0.4) | 0 | (0.0) | 101 | (1.1) | 68 | (0.7) | 582 | (6.3) | 306 | (3.3) |
| 2014 | 9,155 | 8,140 | (88.9) | 18 | (0.2) | 0 | (0.0) | 84 | (0.9) | 82 | (0.9) | 563 | (6.1) | 268 | (2.9) |
| 2015 | 9,281 | 8,178 | (88.1) | 18 | (0.2) | 0 | (0.0) | 110 | (1.2) | 73 | (0.8) | 573 | (6.2) | 329 | (3.5) |
| 2016 | 8,985 | 7,854 | (87.4) | 30 | (0.3) | 0 | (0.0) | 117 | (1.3) | 74 | (0.8) | 603 | (6.7) | 307 | (3.4) |
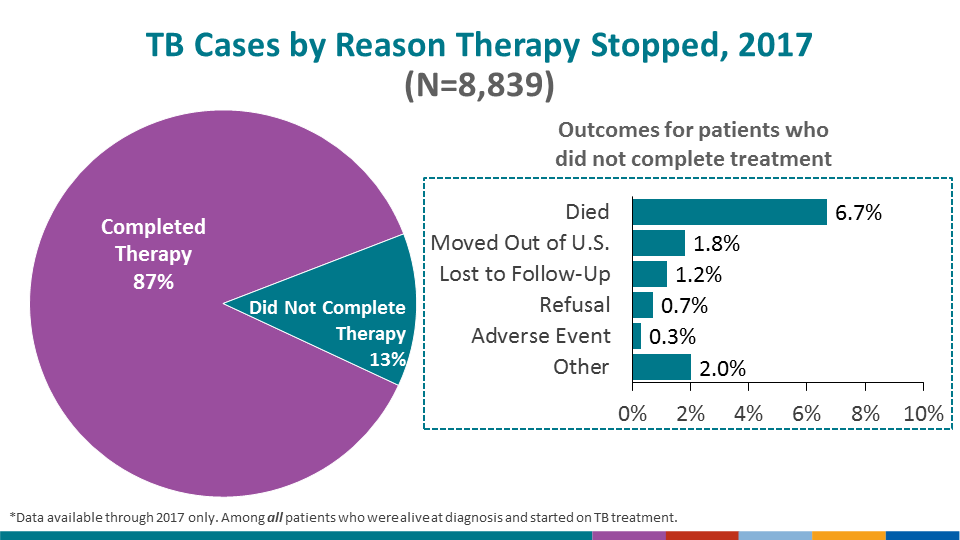
| 2017 | 8,839 | 7,709 | (87.2) | 30 | (0.3) | 0 | (0.0) | 110 | (1.2) | 65 | (0.7) | 593 | (6.7) | 332 | (3.8) |
1Includes all cases in persons reported as alive at diagnosis and taking one or more TB drugs.
2In 2009 the “moved” response option was removed from the RVCT’s reason therapy stopped variable; see Technical Notes for details.
3Died = died of any cause (not only TB).
4Includes cases in persons reporting reason therapy stopped = other, missing, unknown, or moved (from 2010).
Note: Data for all years are updated through June 10, 2020.
Data complete to 2017. See Technical Notes.