Reported Tuberculosis in the United States, 2018
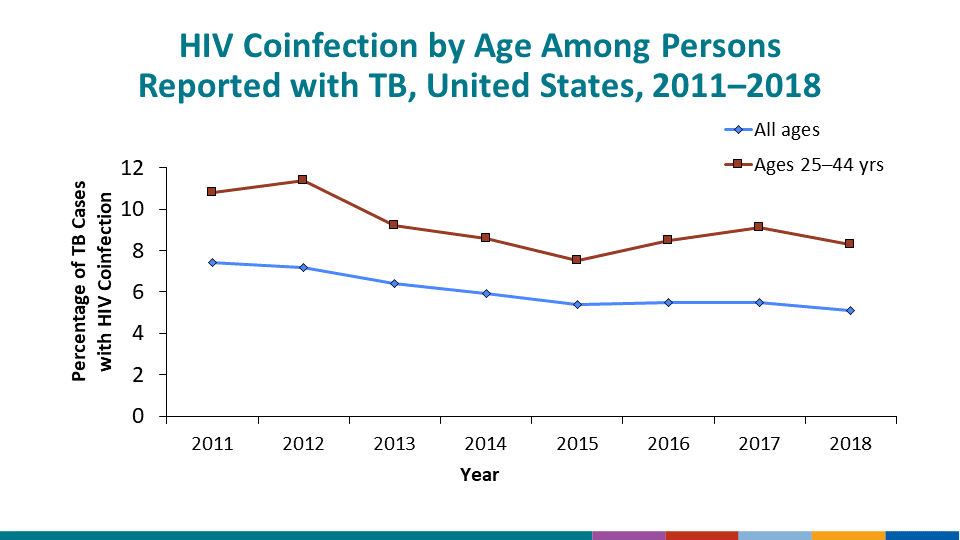
Table 11. Tuberculosis Cases1 and Percentages Among Persons with HIV Test Results2 and with HIV Coinfection by Age Group: United States, 2011–2018
See Surveillance Slide #28
| Year | 25–44 Years Old | All Ages | ||||||||
|---|---|---|---|---|---|---|---|---|---|---|
| Total No. | HIV Test Results | HIV Positive | Total No. | HIV Test Results | HIV Positive | |||||
| No. | (%) | No. | (%) | No. | (%) | No. | (%) | |||
| 20113 | 3,329 | 3,044 | (91.4) | 330 | (10.8) | 10,250 | 8,699 | (84.9) | 648 | (7.4) |
| 2012 | 3,097 | 2,881 | (93.0) | 327 | (11.4) | 9,716 | 8,426 | (86.7) | 610 | (7.2) |
| 2013 | 2,938 | 2,788 | (94.9) | 257 | (9.2) | 9,342 | 8,358 | (89.5) | 535 | (6.4) |
| 2014 | 2,803 | 2,662 | (95.0) | 230 | (8.6) | 9,196 | 8,269 | (89.9) | 491 | (5.9) |
| 2015 | 2,844 | 2,721 | (95.7) | 205 | (7.5) | 9,332 | 8,431 | (90.3) | 456 | (5.4) |
| 2016 | 2,807 | 2,678 | (95.4) | 228 | (8.5) | 9,047 | 8,210 | (90.7) | 452 | (5.5) |
| 2017 | 2,740 | 2,577 | (94.1) | 235 | (9.1) | 8,919 | 7,998 | (89.7) | 436 | (5.5) |
| 2018 | 2,708 | 2,503 | (92.4) | 208 | (8.3) | 8,830 | 7,759 | (87.9) | 397 | (5.1) |
1Persons alive at diagnosis.
2Includes persons with positive, negative, or indeterminate HIV test results.
3California began reporting HIV test results to the Centers for Disease Control and Prevention in 2011. Consequently, 2011 was the first year in which HIV status was ≥90% complete.
Note: Data were updated as of June 6, 2019.