At a glance
When tackling a challenging problem, typical thinking processes use “factor thinking” to reach a solution. Factor thinking is when you think about the causes or associations related to a various problem.

Introduction
What causes people to develop Type 2 diabetes? While we could come up with a long list to help us identify factors associated with diabetes, it wouldn't get us any closer to figuring out how to focus time and limited resources on the highest impact strategies.
But when thinking in systems you might ask "what is really causing the issue I'm concerned about?" A systems thinking technique utilizes "stock and flow diagrams" to help you understand how the system works. Using stocks and flows to map the system you care about can help you identify levers for improving performance in the system.
Stocks and flows can be used to create systems maps that illustrate the connections between different elements of a system.

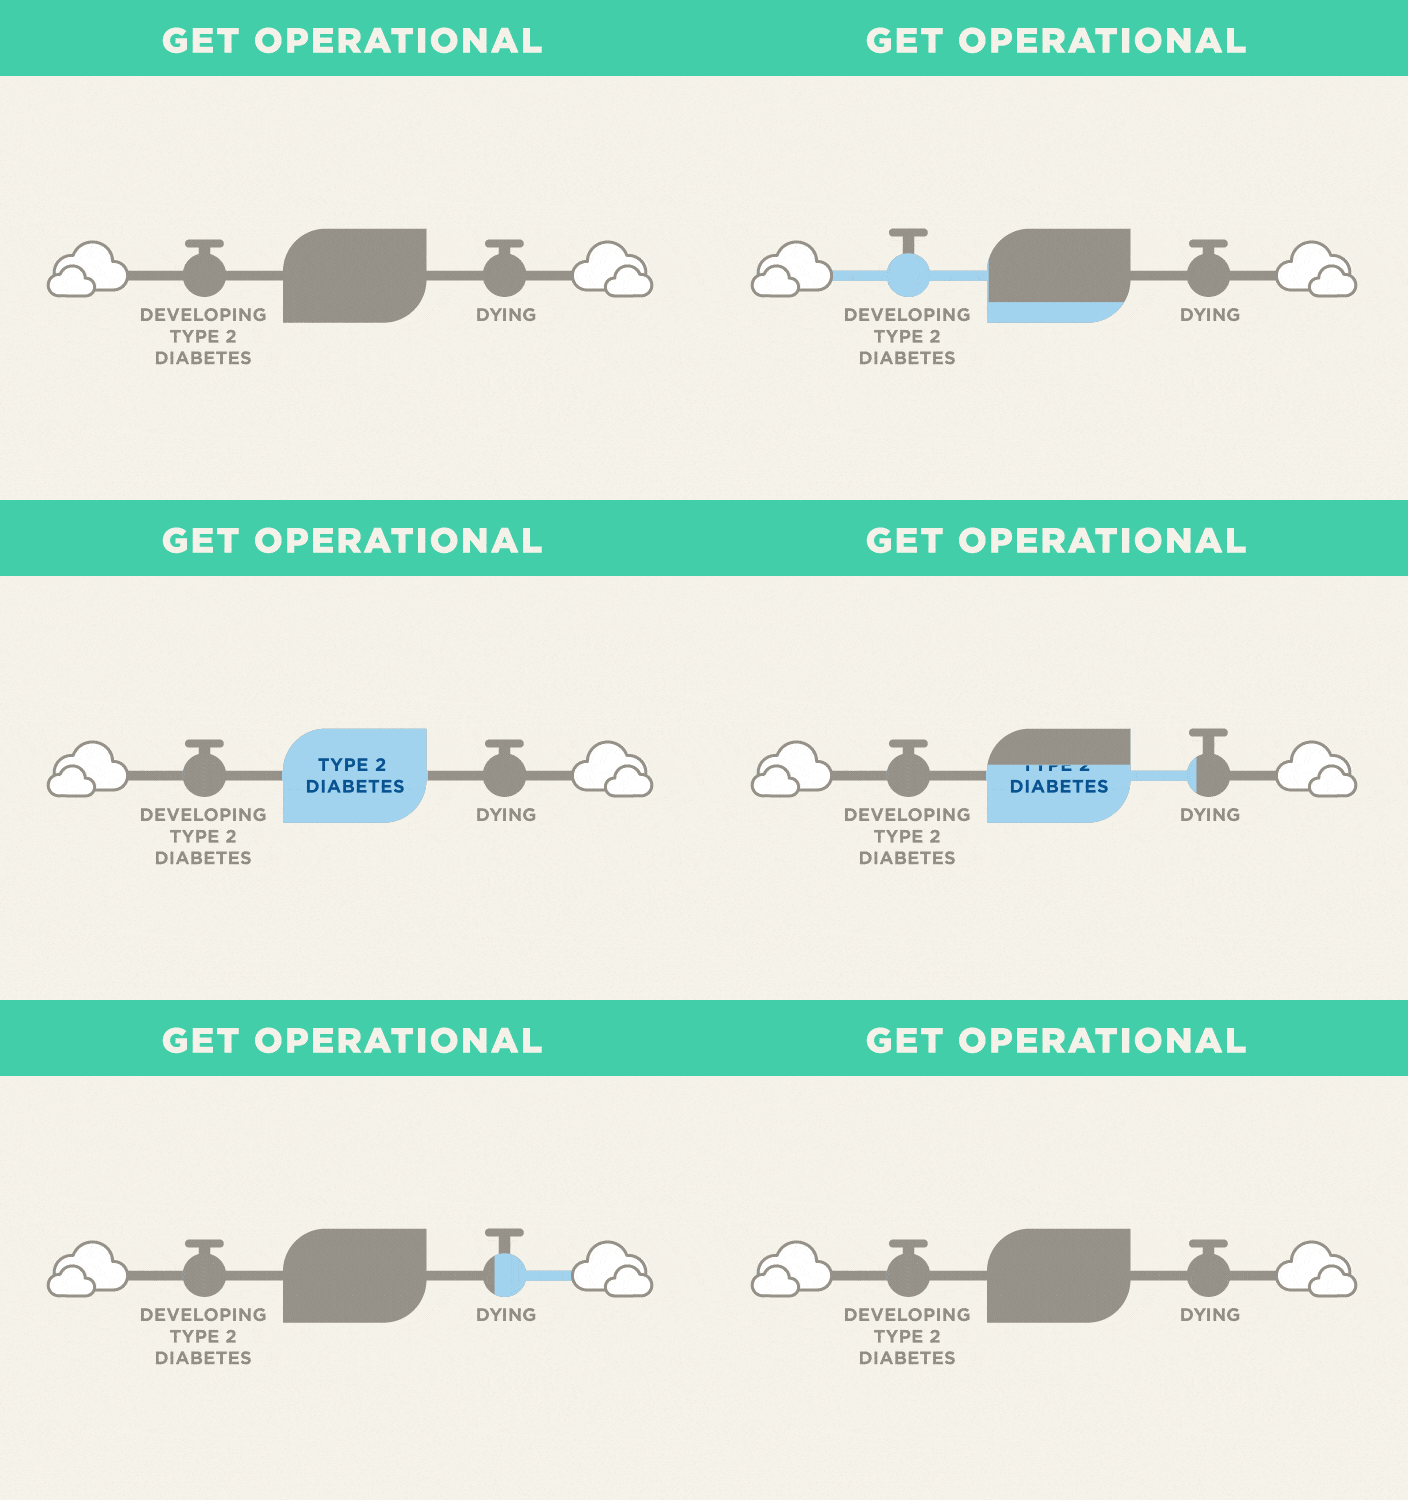
Stocks represent accumulations. Think about water in a bathtub as accumulating. Stocks, at any point in time, can be counted or measured. At any point in time, you can measure the amount of water in a bathtub, the number of open beds in a hospital, the number of people with the flu, etc.
Flows are actions or activities that fill or drain accumulations over time. In this case, a flow into the bathtub increases the stock of water or an outflow from the drain subtracts water from the bathtub. Think of flows as adding to or taking away from stocks. They are actions. You can drain water from the tub, admit or discharge patients from a hospital, or recover from the flu.
Examples from the field
In this example, the way people leave the stock of the "Type 2 diabetic population" is by dying, which is represented as the outflow to the right of the stock.

Note: On this map, you see little clouds at the head end of the inflow and the tail end of the outflow. These clouds represent the boundary of your map—your map doesn't care about what's happening in the clouds. When you create your map, you can decide what your outflow will be and what is outside the scope of your map.
Keep in mind
Using getting operational with the CDC Policy Process
The Policy Analysis domain is when you identify different policy options to address the problem or issue. This is the perfect time to get operational because thinking in systems can help you find higher leverage solutions.

