Total and High-density Lipoprotein Cholesterol in Adults: United States, August 2021–August 2023
NCHS Data Brief No. 515, November 2024
PDF Version (454 KB)
Margaret D. Carroll, M.S.P.H, Cheryl D. Fryar, M.S.P.H, Jane A. Gwira, M.D., M.P.H., and Marisol Iniguez, M.P.H.
- During August 2021–August 2023, the prevalence of high total cholesterol was 11.3% in adults, with no significant difference between men (10.6%) and women (11.9%).
- The prevalence of low high-density lipoprotein cholesterol (HDL-C) for adults was 13.8%, was higher in men (21.5%) than women (6.6%), and declined with increasing age.
- High total cholesterol prevalence declined from 1999–2000 to 2013–2014 and then did not change significantly. Low HDL-C prevalence declined from 2007–2008 to August 2021–August 2023.
High total cholesterol and low high-density lipoprotein cholesterol (HDL-C) are risk factors for heart disease, the leading cause of death in the United States (1). The prevalence of high total cholesterol declined from 1999–2000 to 2017–2018; the prevalence of low HDL-C prevalence declined from 2007–2008 to 2017–2018 (2). This report presents prevalence of high total cholesterol and low HDL-C by sex and age group for adults age 20 and older from the August 2021–August 2023 National Health and Nutrition Examination Survey (NHANES). Trends in the prevalence of high total cholesterol and low HDL-C are also presented.
Keywords: trends, lipids, National Health and Nutrition Examination Survey (NHANES)
What was the prevalence of high total cholesterol in adults during August 2021–August 2023?
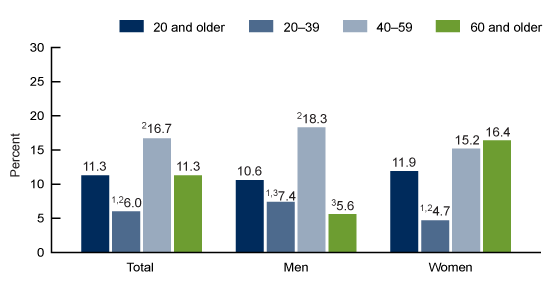
During August 2021–August 2023, 11.3% of adults age 20 and older had high total cholesterol (Figure 1, Table 1). No significant differences in the prevalence of high total cholesterol were seen between men and women (10.6% compared with 11.9%, respectively).
The prevalence of high total cholesterol was higher in adults ages 40–59 (16.7%) than in adults ages 20–39 (6.0%) and 60 and older (11.3%). The prevalence was higher in adults 60 and older compared with adults ages 20–39.
The pattern by age was different among men and women. Among men, the prevalence of high total cholesterol was higher in ages 40–59 compared with ages 20–39 and 60 and older. Among women, the prevalence of high total cholesterol was higher in ages 40–59 and 60 and older compared with ages 20–39.
The prevalence of high total cholesterol was lower in women ages 20–39 than in men of the same age group, but lower in men age 60 and older than in women of the same age group.
Figure 1. Prevalence of high total cholesterol in adults age 20 and older, by sex and age group: United States, August 2021–August 2023

1Significantly different from ages 40–59.
2Significantly different from age 60 and older.
3Significantly different from women of the same age group.
NOTE: High total cholesterol is a serum total cholesterol level of 240 mg/dL or higher. Age-adjusted estimates for adults age 20 and older are 11.2% for the total population, 11.0% for men, and 11.3% for women, and were adjusted by the direct method to the projected 2000 Census population estimates using the age groups 20–39, 40–59, and 60 and older.
SOURCE: National Center for Health Statistics, National Health and Nutrition Examination Survey, August 2021–August 2023.
What was the prevalence of low HDL-C in adults during August 2021–August 2023?
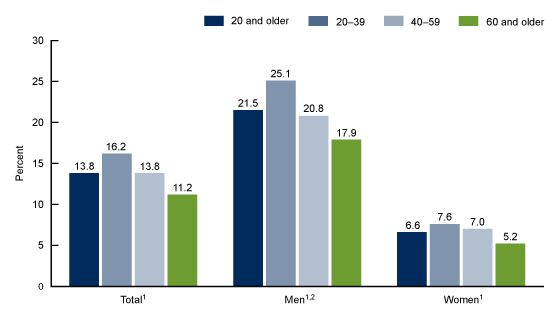
During August 2021–August 2023, the prevalence of low HDL-C was 13.8% in adults and was higher in men (21.5%) than in women (6.6%), overall and within each age group (Figure 2, Table 2).
The prevalence of low-HDL-C declined with increasing age for all adults (16.2% for ages 20–39 to 11.2% for age 60 and older), men (25.1% for ages 20–39 to 17.9% for age 60 and older), and women (7.6% for ages 20–39 to 5.2% for age 60 and older).
Figure 2. Prevalence of low high-density lipoprotein cholesterol in adults age 20 and older, by sex and age group: United States, August 2021–August 2023

1Significantly decreasing linear trend with increasing age group.
2Significantly different from women of the same age group.
NOTES: Low high-density lipoprotein cholesterol (HDL-C) is serum HDL-C less than 40 mg/dL. Age-adjusted estimates for adults age 20 and older are 14.2% for the total population, 21.8% for men, and 6.8% for women, and were adjusted by the direct method to the projected 2000 Census population estimates using the age groups 20–39, 40–59, and 60 and older.
SOURCE: National Center for Health Statistics, National Health and Nutrition Examination Survey, August 2021–August 2023.
What were trends in the prevalence of age-adjusted high total cholesterol and low HDL-C in adults?
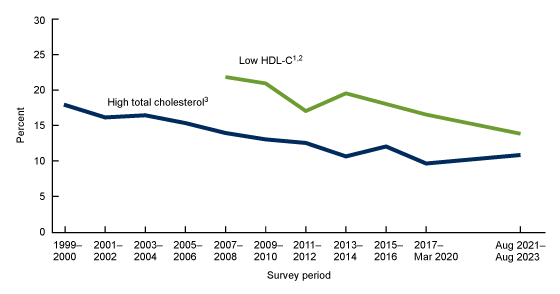
The prevalence of high total cholesterol declined from 18.3% in 1999–2000 to 11.0% in 2013–2014 and then did not change significantly (Figure 3, Table 3). The prevalence of low HDL-C declined from 22.2% in 2007–2008 to 14.2% in August 2021–August 2023.
Changes in the prevalence of high total cholesterol and low HDL-C between the two most recent survey cycles, 2017–March 2020 and August 2021–August 2023, were not significant.
Figure 3. Trends in age-adjusted prevalence of high total cholesterol and low high-density lipoprotein cholesterol in adults age 20 and older: UnitedStates, 1999–2000 to August 2021–August 2023

1Percentages before 2007–2008 are not presented due to changes in laboratories and methods.
2Significantly decreasing linear trend.
3Significant decrease from 1999–2000 to 2013–2014, and no change from 2013–2014 to August 2021–August 2023.
NOTES: High total cholesterol is a serum total cholesterol level of 240 mg/dL or more. Low high-density lipoprotein cholesterol (HDL-C) is serum HDL-C less than 40 mg/dL. Estimates were age adjusted by the direct method to the projected 2000 Census population estimates using the age groups 20–39, 40–59, and 60 and older.
SOURCE: National Center for Health Statistics, National Health and Nutrition Examination Survey, 1999–2000 to August 2021–August 2023.
Summary
During August 2021–August 2023, 11.3% of adults had high total cholesterol. The prevalence of high total cholesterol was higher in men ages 40–59 than in men ages 20–39 and 60 and older, and higher in women ages 40–59 and 60 and older than in women ages 20–39. Similar patterns were observed in previous NHANES surveys (3). The prevalence of low HDL-C during August 2021–August 2023 was 13.8%, and was higher in men than in women, overall and within each age group. Again, similar results were observed in previous NHANES surveys (3).
The prevalence of high total cholesterol declined from 1999–2000 to 2013–2014 and then did not change significantly. The prevalence of low HDL-C declined from 2007–2008 to August 2021–August 2023.
In this report, consistent with previously published reports (2,3), an HDL-C threshold of 40 mg/dL was used rather than the sex-specific thresholds used to define metabolic syndrome (for men < 40 mg/dL and women < 50 mg/dL) (4). Clinical blood cholesterol management guidelines depend on additional factors, including a calculated atherosclerotic cardiovascular disease risk score based, in part, on specific HDL-C and total cholesterol values rather than thresholds (4).
Definitions
High total cholesterol: Serum total cholesterol level of 240 mg/dL or higher.
Low high-density lipoprotein cholesterol (HDL-C): Serum HDL-C less than 40 mg/dL.
Data source and methods
This report used NHANES data from 1999–2000 to August 2021–August 2023 for these analyses. NHANES is a cross-sectional survey designed to monitor the health and nutritional status of the U.S. civilian noninstitutionalized population using stratified, multistage probability designs. The survey includes interviews conducted in participants’ homes and health examinations conducted in mobile examination centers. Due to the COVID-19 pandemic, survey operations were altered for data collection during August 2021–August 2023 (5). Phlebotomy sample weights, accounting for the differential selection probabilities and adjusting for nonresponse and noncoverage for the examination and additional nonresponse to the blood draw component, were used to estimate prevalence. Standard errors of prevalence were estimated using Taylor series linearization (6). Estimates for trends over time were age adjusted to the projected 2000 Census standard population using the age groups 20–39, 40–59, and 60 and older to compare prevalence estimates over time for populations that have different age distributions.
Data from NHANES August 2021–August 2023 were used to test differences between subgroups. Eleven NHANES cycles (1999–2000 to August 2021–August 2023) were used in testing for trends in the prevalence of high total cholesterol. Seven NHANES cycles (2007–2008 to August 2021–August 2023) were used in testing for trends in the prevalence of low HDL-C because HDL-C measurement methods before 2007–2008 differed from subsequent cycles and may not be directly comparable (7). Differences between groups were tested using a t statistic at the p < 0.05 significance level. Linear trends across age groups were tested using orthogonal contrast matrices. Linear and quadratic trends across surveys (adjusting for different times between survey cycles) and adjusted for age were evaluated using regression models. If a quadratic trend was significant, Joinpoint statistical software was used to find the change point, and piecewise regression was used to test for a difference in slope. All differences reported are statistically significant unless otherwise indicated. Adjustments were not made for multiple comparisons. Statistical analyses were conducted using the SAS System for Windows version 9.4 (SAS Institute, Inc., Cary, N.C.) and SUDAAN version 11.1 (RTI International, Research Triangle Park, N.C.).
About the authors
Margaret D. Carroll, Cheryl D. Fryar, and Marisol Iniguez are with the National Center for Health Statistics, Division of Health and Nutrition Examination Surveys. Jane A. Gwira was with the National Center for Health Statistics, Division of Health and Nutrition Examination Surveys during the analysis and writing of this report.
References
- Curtin SC, Tejada-Vera B, Bastian BA. Deaths: Leading causes for 2021. National Vital
Statistics Reports; vol 73 no 4. Hyattsville, MD: National Center for Health Statistics. 2024. DOI: https://dx.doi.org/10.15620/cdc/147882. - Carroll MD, Fryar CD. Total and high-density lipoprotein cholesterol in adults: United States,
2015–2018. NCHS Data Brief, no 363. Hyattsville, MD: National Center for Health Statistics 2020.
- Carroll MD, Fryar CD, Nguyen DT. High total and low high-density lipoprotein cholesterol in adults: United States, 2015–2016. NCHS Data Brief, no 290. Hyattsville, MD: National Center for Health Statistics. 2017.
- Grundy SM, Stone NJ, Bailey AL, Beam C, Birtcher KK, Blumenthal RS, et al. 2018. AHA/ACC/AACVPR/AAPA/ABC/ACPM/ADA/AGS/APhA/ASPC/NLA/PCNA guideline on the management of blood cholesterol: A report of the American College of Cardiology/American Heart Association Task Force on Clinical Practice Guidelines. Circulation 139(25):e1082–43. 2019. DOI: https://dx.doi.org/10.1161/CIR.0000000000000625.
- Terry AL, Chiappa MM, McAllister J, Woodwell DA, Graber JE. Plan and operations of the National Health and Nutrition Examination Survey, August 2021–August 2023. National Center for Health Statistics. Vital Health Stat 1(66). 2024. DOI: https://dx.doi.org/10.15620/cdc/151927.
- Wolter KM. Chapter 6: Taylor series methods. In: Introduction to variance estimation. 2nd ed. New York, NY: Springer. 2007.
- National Center for Health Statistics. National Health and Nutrition Examination Survey: 2007–2008 data documentation, codebook, and frequencies. 2010.
Suggested citation
Carroll MD, Fryar CD, Gwira JA, Iniguez M. Total and high-density lipoprotein cholesterol in adults: United States, August 2021–August 2023. NCHS Data Brief, no 515. Hyattsville, MD: National Center for Health Statistics. 2024. DOI: https://dx.doi.org/10.15620/cdc/165796.
Copyright information
All material appearing in this report is in the public domain and may be reproduced or copied without permission; citation as to source, however, is appreciated.
National Center for Health Statistics
Brian C. Moyer, Ph.D., Director
Amy M. Branum, Ph.D., Associate Director for Science
Division of Health and Nutrition Examination Surveys
Alan E. Simon, M.D., Director
Lara J. Akinbami, M.D., Associate Director for Science