Bullying Victimization Among Teenagers: United States, July 2021 – December 2023
- Key findings
- During July 2021–December 2023, about one-third of teenagers were bullied in the last 12 months.
- The percentage of teenagers who were bullied varied by age, sex, and sexual or gender minority status.
- The percentage of teenagers who were bullied varied by race and Hispanic origin and developmental disability status.
- The percentage of teenagers with symptoms of anxiety or depression in the past 2 weeks varied by whether or not teenagers were bullied.
Data from the National Health Interview Survey–Teen
- From July 2021 to December 2023, 34.0% of teenagers were bullied in the last 12 months.
- Sexual or gender minority teenagers were more likely to be bullied (47.1%) than teenagers who are not a sexual or gender minority (30.0%).
- White non-Hispanic teenagers were more likely to be bullied compared with teenagers in other race and Hispanic-origin groups.
- Teenagers with a developmental disability (44.4%) were more likely to be bullied than teenagers without a developmental disability (31.3%).
- Teenagers who were bullied were nearly twice as likely to experience symptoms of anxiety (29.8%) or depression (28.5%) in the last 2 weeks when compared with teenagers who were not bullied.
Bullying victimization occurs when a person is exposed to aggressive behaviors repeatedly over time by one or more people and is unable to defend themself (1). Bullying victimization during childhood and adolescence has life-long consequences and is a public health issue of national concern (2). Previous research shows being bullied is associated with long-term psychological impact to well-being and poor mental health outcomes (2,3). Using data from the July 2021–December 2023 National Health Interview Survey–Teen (NHIS–Teen), this report describes the percentage of teenagers (ages 12–17) who self-reported that they experienced bullying victimization (referred to as ever being bullied) in the past 12 months, by selected characteristics.
Keywords: adolescent health, prevalence, schools, mental health, National Health Interview Survey–Teen (NHIS–Teen)
During July 2021–December 2023, about one-third of teenagers were bullied in the last 12 months.
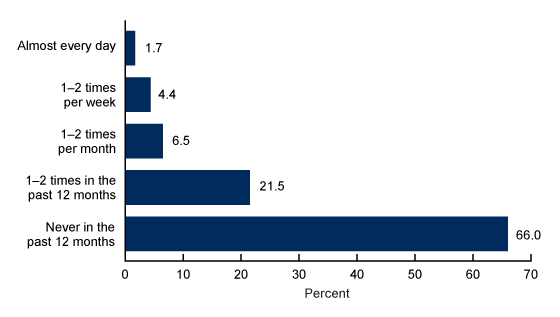
- During July 2021 to December 2023, 34.0% of teenagers ages 12–17 were bullied in the past 12 months (Figure 1, Table 1).
- In total, 21.5% were bullied 1–2 times in the past 12 months, 6.5% were bullied 1–2 times per month, 4.4% were bullied 1–2 times per week, and 1.7% of teenagers were bullied almost every day.
Figure 1. Percent distribution of teenagers ages 12–17, by frequency of bullying in the past 12 months: United States, July 2021–December 2023

NOTES: Estimates are based on household interviews of a sample of the U.S. civilian noninstitutionalized population. Numbers do not add to 100 due to rounding.
SOURCE: National Center for Health Statistics, National Health Interview Survey‒Teen, July 2021–December 2023.
The percentage of teenagers who were bullied varied by age, sex, and sexual or gender minority status.
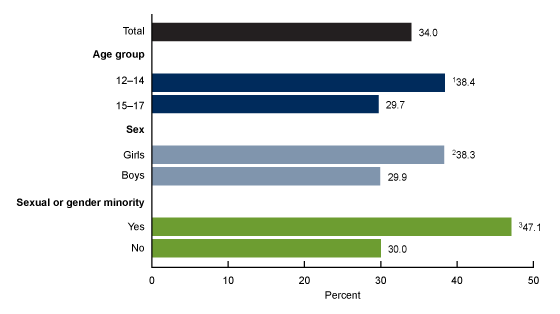
- The percentage of teenagers ages 12–17 who were bullied was higher among younger teenagers ages 12–14 (38.4%) than among teenagers ages 15–17 (29.7%) (Figure 2, Table 2).
- The percentage of teenagers who were bullied in the past 12 months was higher among girls (38.3%) compared with boys (29.9%).
- The percentage of teenagers who were bullied was higher among teenagers who were a sexual or gender minority (47.1%) than those who were not (30.0%).
Figure 2. Percentage of teenagers ages 12‒17 who were bullied in the past 12 months, by age group, sex, and sexual or gender minority status: United States, July 2021‒December 2023

1Significantly different from ages 15‒17 (p < 0.05).
2Significantly different from boys (p < 0.05).
3Significantly different from teenagers who are not sexual or gender minorities (p < 0.05).
NOTES: See Definitions in this report for sexual or gender minority status definition. Estimates are based on household interviews of a sample of the U.S. civilian noninstitutionalized population.
SOURCE: National Center for Health Statistics, National Health Interview Survey–Teen, July 2021–December 2023.
The percentage of teenagers who were bullied varied by race and Hispanic origin and developmental disability status.
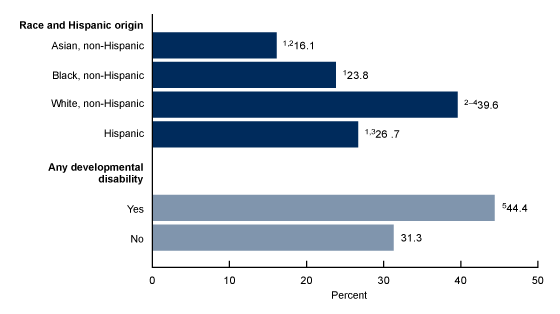
- White non-Hispanic (subsequently, White) teenagers ages 12–17 were more likely to be bullied in the past 12 months (39.6%) compared with Asian non-Hispanic (subsequently, Asian) (16.1%), Black non-Hispanic (subsequently, Black) (23.8%), and Hispanic (26.7%) teenagers (Figure 3, Table 3).
- Asian teenagers were less likely be bullied than Hispanic teenagers. The observed difference between Asian and Black teenagers was not significant.
- Teenagers with a developmental disability (44.4%) were more likely be bullied than teenagers without a developmental disability (31.3%).
Figure 3. Percentage of teenagers ages 12–17 who were bullied in the past 12 months, by race and Hispanic origin and developmental disability status: United States, July 2021–December 2023

1Significantly different from White non-Hispanic teenagers (p < 0.05).
2Significantly different from Hispanic teenagers (p < 0.05).
3Significantly different from Asian non-Hispanic teenagers (p < 0.05).
4Significantly different from Black non-Hispanic teenagers (p < 0.05).
5Significantly different from teenagers without a developmental disability (p < 0.05).
NOTES: Teenagers of Hispanic origin may be of any race. Estimates are based on household interviews of a sample of the U.S. civilian noninstitutionalized population.
SOURCE: National Center for Health Statistics, National Health Interview Survey‒Teen, July 2021–December 2023.
The percentage of teenagers with symptoms of anxiety or depression in the past 2 weeks varied by whether or not teenagers were bullied.
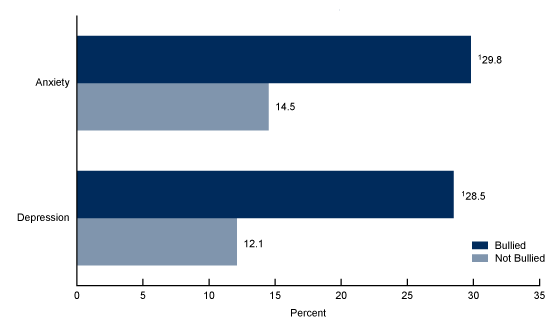
- The percentage of teenagers ages 12–17 with anxiety symptoms in the past 2 weeks was significantly higher among teenagers who were bullied in the past 12 months (29.8%) than those who were not (14.5%) (Figure 4, Table 4).
- The percentage of teenagers with depression symptoms was significantly higher among teenagers who were bullied (28.5%) than those who were not (12.1%).
Figure 4. Percentage of teenagers ages 12–17 who had symptoms of anxiety or depression in the past 2 weeks, by whether they were bullied in the past 12 months: United States, July 2021–December 2023

1Significantly different from teenagers who were not bullied in the past 12 months (p < 0.05).
NOTE: Estimates are based on household interviews of a sample of the U.S. civilian noninstitutionalized population.
SOURCE: National Center for Health Statistics, National Health Interview Survey–Teen, July 2021–December 2023.
Summary
This report describes bullying victimization among U.S. teenagers ages 12–17 by age, sex, sexual or gender minority status, race and Hispanic-origin group, and developmental disability status from July 2021 to December 2023 by using data reported directly from teenagers. The report also explores whether the presence of anxiety and depression symptoms in the past 2 weeks differs by the teenager’s experience of being bullied in the past 12 months. Overall, results show that about one-third of teenagers were bullied in the past 12 months. Younger teenagers ages 12–14, girls, gender or sexual minority teenagers, White teenagers, and teenagers with developmental disabilities were more likely to be bullied in the past 12 months. Teenagers who were bullied were more likely to experience symptoms of both anxiety and depression. Given the detrimental and long-lasting impact of bullying on health, it is important to better understand the factors associated with bullying victimization (2).
Definitions
Anxiety symptoms: Measured using the Generalized Anxiety Disorder-2 (GAD-2) scale (4). Teenagers were asked, “Over the last 2 weeks, how often have you been bothered by feeling nervous, anxious, or on edge?” and “Over the last 2 weeks, how often have you been bothered by not being able to stop or control worrying?” Response options were “not at all,” “several days,” “more than half the days,” and “nearly every day,” with scores assigned as zero, one, two, or three, respectively. Teenagers who scored three or more on the two questions combined were considered to have symptoms of anxiety per GAD-2 scoring guidelines. Teenagers who did not answer both questions were excluded.
Bullying victimization: Respondents who answered “1–2 times in the past 12 months,” “1–2 times per month,” “1–2 times per week,” or “almost every day” on the questionnaire item asking, “During the past 12 months, how often were you bullied, picked on, or excluded by other children or teenagers?”
Depression symptoms: Measured using the Patient Health Questionnaire-2 (PHQ-2) (5). Teenagers were asked, “Over the last 2 weeks, how often have you been bothered by having little interest or pleasure in doing things?” and “Over the last 2 weeks, how often have you been bothered by feeling down, depressed, or hopeless?” Like GAD-2, response options were
“not at all,” “several days,” “more than half the days,” and “nearly every day,” with scores assigned as zero, one, two, or three, respectively. Teenagers who scored three or more on the two questions combined were considered to have symptoms of depression per PHQ-2 scoring guidelines. Teenagers who did not answer both questions were excluded.
Developmental and learning disability status: Children were considered to have a developmental disability if they were diagnosed with one or more of five selected developmental disabilities: attention deficit disorder (ADD) or attention-deficit/hyperactivity disorder (ADHD), autism spectrum disorder, intellectual disability, learning disability, or other developmental delay.
Race and Hispanic origin: Teenagers categorized as non-Hispanic indicated one race only; respondents had the option to select more than one racial group. Hispanic teenagers could be any race or combination of races. Estimates for non-Hispanic children of races other than Asian, Black, and White are not shown due to the inability to make statistically reliable estimates for these groups, but they are included in total estimates.
Sexual or gender minority: Based on three questions from the teen interview asking about sexual orientation and gender identity.
- Sexual minority: Based on the survey question, “Which of the following best represents how you think of yourself?” Answer choices included “Gay or lesbian,” “Straight, that is not gay or lesbian,” “Bisexual,” “Something else,” and “I’m not sure/I don’t know the answer.” Respondents who answered anything other than “Straight, that is not gay or lesbian” were categorized as a sexual minority.
- Gender minority: Respondents were asked about gender identity with two questions. First, “What sex were you assigned at birth, on your original birth certificate?” and answer choices were “Male; Female; I don’t know.” Second, “How do you currently describe yourself?” and answer choices were “Male; Female; Transgender; None of these; I’m not sure/I don’t know the answer.” Respondents who said they were transgender or whose sex did not match between the two questions were considered to be a gender minority. Respondents whose sex matched between the two questions were not considered to be a gender minority. Respondents who answered “I don’t know” for the first question were considered missing. More information on the questions and variables used for this measure can be found in the teen questionnaire (6).
Data source and methods
NHIS–Teen is a web-based, self-administered follow-back survey of adolescents sampled in NHIS as part of the Sample Child interview. It includes adolescents between ages 12–17 whose parent completed the NHIS Sample Child interview and provided permission for their teenager to be invited to participate in NHIS–Teen. Eligible teenagers received an invitation letter and a series of planned reminders with instructions for completing a 15-minute online health survey. On average, teenagers completed the survey within 2–3 weeks of the parent interview.
NHIS–Teen covers topics such as physical activity, sedentary activity, use of social media and electronic devices, friendships, bullying, symptoms of poor mental health, and resilience as reported by teenagers themselves. The parent permission rate for NHIS–Teen was 60.4%, and the teen participation rate was 46.2%, resulting in an overall NHIS–Teen interview rate of 27.9%. More detailed information about NHIS–Teen, including its methodology and recruitment strategy, has been previously published (7).
Teen and family characteristics are based on data provided by the teenager’s parent as part of the NHIS Sample Child interview, except for sexual or gender minority status, which is reported by the teenager as part of NHIS–Teen. Point estimates and the corresponding confidence intervals were calculated using SAS-callable SUDAAN software (8) to account for the complex sample design of NHIS–Teen. All estimates in this report meet National Center for Health Statistics data presentation standards for proportions (9). Differences between percentages were evaluated using two-sided significance tests at the 0.05 level.
About the authors
Gelila Haile, Basilica Arockiaraj, Benjamin Zablotsky, and Amanda E. Ng are with the National Center for Health Statistics, Division of Health Interview Statistics. At the time of this report, Gelila Haile and Basilica Arockiaraj were guest researchers at the National Center for Health Statistics through the Oak Ridge Institute for Science and Education fellowship program.
References
- Gladden RM, Vivolo-Kantor AM, Hamburger ME, Lumpkin CD. Bullying surveillance among youths: Uniform definitions for public health and recommended data elements, version 1.0. National Center for Injury Prevention and Control and U.S. Department of Education. 2014.
- Moore SE, Norman RE, Suetani S, Thomas HJ, Sly PD, Scott JG. Consequences of bullying victimization in childhood and adolescence: A systematic review and meta-analysis. World J Psychiatry 7(1):60‒76. 2017. DOI: https://dx.doi.org/10.5498/wjp.v7.i1.60.
- Armitage R. Bullying in children: Impact on child health. BMJ Paediatr Open 5(1):e000939. 2021. DOI: https://dx.doi.org/10.1136/bmjpo-2020-000939.
- Kroenke K, Spitzer RL, Williams JBW, Monahan PO, Löwe B. Anxiety disorders in primary care: Prevalence, impairment, comorbidity, and detection. Ann Intern Med 146(5):317–25. 2007.
- Kroenke K, Spitzer RL, Williams JBW. The Patient Health Questionnaire-2: Validity of a two-item depression screener. Med Care 41(11):1284–92. 2003.
- National Center for Health Statistics. National Health Interview Survey–Teen (NHIS–Teen). 2021.
- Zablotsky B, Black LI, Ng AE, Bose J, Jones J, Maitland A, Blumberg SJ. Methodology report for the 2021–2023 National Health Interview Survey–Teen 30-month file. 2024.
- RTI International. SUDAAN (Release 11.0.3) [computer software]. 2018.
- Parker JD, Talih M, Malec DJ, Beresovsky V, Carroll M, Gonzalez JF Jr, et al. National Center for Health Statistics data presentation standards for proportions. National Center for Health Statistics. Vital Health Stat 2(175). 2017.
Suggested citation
Haile G, Arockiaraj B, Zablotsky B, Ng AE. Bullying victimization among teenagers: United States, July 2021–December 2023. NCHS Data Brief, no 514. Hyattsville, MD: National Center for Health Statistics. 2024. DOI: https://dx.doi.org/10.15620/cdc/168510.
Copyright information
All material appearing in this report is in the public domain and may be reproduced or copied without permission; citation as to source, however, is appreciated.
National Center for Health Statistics
Brian C. Moyer, Ph.D., Director
Amy M. Branum, Ph.D., Associate Director for Science
Division of Health Interview Statistics
Stephen J. Blumberg, Ph.D., Director
Anjel Vahratian, Ph.D., M.P.H., Associate Director for Science