Hypertension Prevalence, Awareness, Treatment, and Control Among Adults Age 18 and Older: United States, August 2021–August 2023
NCHS Data Brief No. 511, October 2024
PDF Version (545 KB)
Cheryl D. Fryar, M.S.P.H., Brian Kit, M.D., Margaret D. Carroll, M.S.P.H., and Joseph Afful, M.S.
- Key findings
- Were there differences in the prevalence of hypertension in adults by sex and age during August 2021–August 2023?
- Did awareness of hypertension differ among adults with hypertension by sex and age during August 2021–August 2023?
- Did treatment of hypertension differ among adults with hypertension by sex and age during August 2021–August 2023?
- Did control of hypertension differ among adults with hypertension by sex and age during August 2021–August 2023?
Data from the National Health and Nutrition Examination Survey
- During August 2021–August 2023, the prevalence of adult hypertension was 47.7%. Hypertension was higher in men (50.8%) than women (44.6%) and increased with age: 23.4% for ages 18–39, 52.5% for 40–59, and 71.6% for 60 and older.
- Among adults with hypertension, 59.2% were aware of their hypertension
- More than one-half of adults with hypertension were currently taking medication (51.2%) to lower blood pressure.
- About one-fifth of adults with hypertension had their blood pressure controlled (20.7%) to less than 130/80 mm Hg.
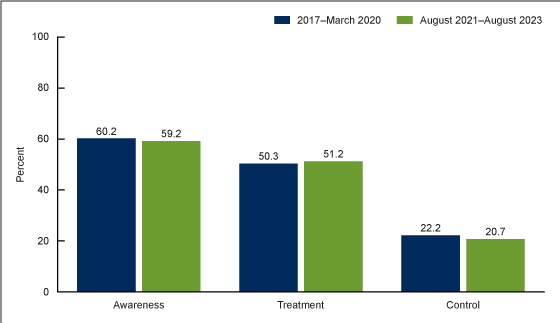
- No significant change was seen in awareness, treatment, or control of hypertension among adults with hypertension between 2017–March 2020 and August 2021–August 2023.
Hypertension affects almost one-half the U.S. adult population (1) and is an important risk factor for cardiovascular disease (2). During 2017–March 2020, 48.1% of adults had hypertension. Among adults with hypertension, more than one-half reported taking medication to lower their blood pressure and about one-fifth had their blood pressure under control (3). This report presents the latest findings from the National Health and Nutrition Examination Survey on the prevalence, awareness, treatment, and control of hypertension among adults in the United States during August 2021–August 2023.
Keywords: high blood pressure, National Health and Nutrition Examination Survey (NHANES)
Were there differences in the prevalence of hypertension in adults by sex and age during August 2021–August 2023?
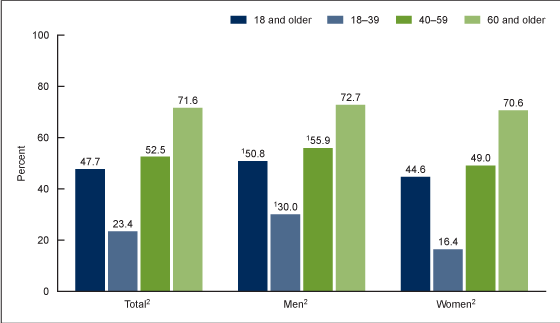
Hypertension prevalence in adults age 18 and older was 47.7% and was higher in men (50.8%) than women (44.6%) (Figure 1, Table 1). The prevalence of hypertension increased with age. The prevalence was 23.4% in adults ages 18–39 and increased to 52.5% for ages 40–59 and 71.6% for 60 and older.
For both men and women, a similar pattern of increasing prevalence of hypertension by age was observed. Hypertension prevalence was higher in men than women ages 18–39 (30.0% compared with 16.4%) and 40–59 (55.9% compared with 49.0%), but the prevalence was not significantly different between men and women age 60 and older.
Figure 1. Prevalence of hypertension in adults age 18 and older, by sex and age: United States, August 2021–August 2023
1Significantly different from women in the same age group.
2Significant increasing trend by age.
NOTES: Hypertension is defined as systolic blood pressure greater than or equal to 130 mm Hg or diastolic blood pressure greater than or equal to 80 mm Hg, or currently taking medication to lower blood pressure. Estimates for age group 18 and older, when age adjusted by the direct method to the U.S. Census 2000 population using age groups 18–39, 40–59, and 60 and older, are 44.5% for total population, 48.8% for men, and 40.1% for women.
SOURCE: National Center for Health Statistics, National Health and Nutrition Examination Survey, August 2021–August 2023.
Did awareness of hypertension differ among adults with hypertension by sex and age during August 2021–August 2023?
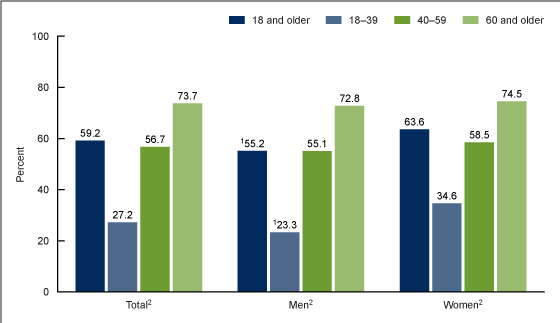
During August 2021–August 2023, 59.2% of adults with hypertension were aware of their hypertension status (Figure 2, Table 2). The prevalence of hypertension awareness increased with age overall and among both men and women. The prevalence was 27.2% among adults ages 18–39 and increased to 56.7% for ages 40–59 and 73.7% for 60 and older.
Hypertension awareness was lower among men (55.2%) than women (63.6%) overall and among young adults 18–39 (23.3% compared with 34.6%), but the prevalence was not significantly different between men and women ages 40–59 and 60 and older.
Figure 2. Prevalence of hypertension awareness among adults age 18 and older with hypertension, by sex and age: United States, August 2021–August 2023
1Significantly different from women in the same age group.
2Significant increasing trend by age.
NOTES: Hypertension is defined as systolic blood pressure greater than or equal to 130 mm Hg or diastolic blood pressure greater than or equal to 80 mm Hg, or currently taking medication to lower blood pressure. Among those with hypertension, awareness is defined as a yes response to the survey question, “Have you ever been told by a doctor or health professional that you had hypertension, also called high blood pressure?”
SOURCE: National Center for Health Statistics, National Health and Nutrition Examination Survey, August 2021–August 2023.
Did treatment of hypertension differ among adults with hypertension by sex and age during August 2021–August 2023?
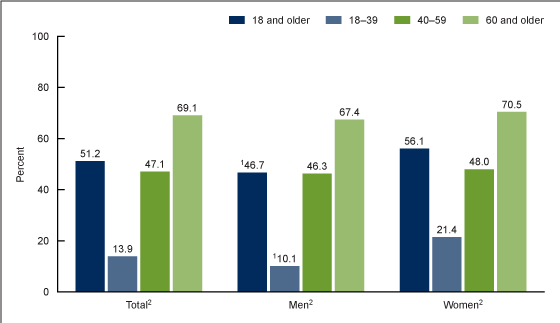
Among adults with hypertension during August 2021–August 2023, 51.2% reported taking medications for treatment of their hypertension (Figure 3, Table 3). The prevalence of hypertension treatment increased with age overall and among men and women. The prevalence was 13.9% among adults ages 18–39 and increased to 47.1% for ages 40–59 and 69.1% for 60 and older.
Hypertension treatment was lower among men (46.7%) than women (56.1%) overall and among young adults 18–39 (10.1% compared with 21.4%), but the prevalence was not significantly different between men and women ages 40–59 and 60 and older.
Figure 3. Prevalence of hypertension treatment among adults age 18 and older with hypertension, by sex and age: United States, August 2021–August 2023
1Significantly different from women in the same age group.
2Significant increasing trend by age.
NOTES: Hypertension is defined as systolic blood pressure greater than or equal to 130 mm Hg or diastolic blood pressure greater than or equal to 80 mm Hg, or currently taking medication to lower blood pressure. Among those with hypertension, treatment is defined as currently taking medication to lower blood pressure, based on a yes response to the survey question, “Are you now taking any medication prescribed by a doctor for your high blood pressure?”
SOURCE: National Center for Health Statistics, National Health and Nutrition Examination Survey, August 2021–August 2023.
Did control of hypertension differ among adults with hypertension by sex and age during August 2021–August 2023?
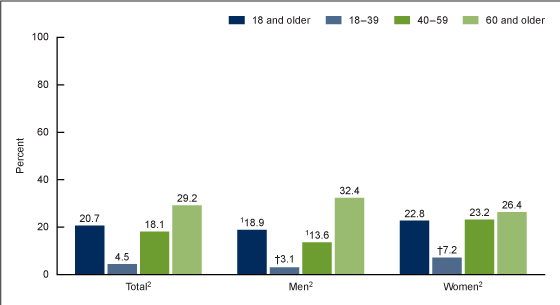
Among adults with hypertension, 20.7% had controlled hypertension during August 2021– August 2023 (Figure 4, Table 4). The prevalence of hypertension control increased with age overall and among men and women. The prevalence was 4.5% among adults ages 18–39 and increased to 18.1% for ages 40–59 and 29.2% for 60 and older.
The prevalence of controlled hypertension was lower among men (18.9%) than women (22.8%) overall and for those ages 40–59 (13.6% compared with 23.2%). The observed difference between men and women age 60 and older was not significant.
Figure 4. Prevalence of hypertension control among adults age 18 and older with hypertension, by sex and age: United States, August 2021–August 2023
† Estimate does not meet National Center for Health Statistics presentation standards for proportions; for more information, see “National Center for Health Statistics Data Presentation Standards for Proportions,” available from: https://www.cdc.gov/nchs/data/series/sr_02/sr02_175.pdf.
1Significantly different from women in the same age group.
2Significant increasing trend by age.
NOTES: Hypertension is defined as systolic blood pressure greater than or equal to 130 mm Hg or diastolic blood pressure greater than or equal to 80 mm Hg, or currently taking medication to lower blood pressure. Among those with hypertension, control is defined as having systolic blood pressure below 130 mm Hg and diastolic blood pressure below 80 mm Hg.
SOURCE: National Center for Health Statistics, National Health and Nutrition Examination Survey, August 2021–August 2023.
Were there differences in the prevalence of awareness, treatment, or control of hypertension among adults with hypertension between 2017–March 2020 and August 2021–August 2023?
No significant change was seen between 2017–March 2020 and August 2021–August 2023 in the prevalence of hypertension awareness (60.2% compared with 59.2%), treatment (50.3% and 51.2%), or control (22.2% and 20.7%) among adults with hypertension (Figure 5, Table 5).
Figure 5. Prevalence of hypertension awareness, treatment, and control among adults age 18 and older with hypertension: United States, 2017–March 2020 and August 2021–August 2023
NOTES: Hypertension is defined as systolic blood pressure greater than or equal to 130 mm Hg or diastolic blood pressure greater than or equal to 80 mm Hg, or currently taking medication to lower blood pressure. Among those with hypertension, awareness is defined as a yes response to the survey question, “Have you ever been told by a doctor or health professional that you had hypertension, also called high blood pressure?”; treatment is defined as currently taking medication to lower blood pressure, based on a yes response to the question, “Are you now taking any medication prescribed by a doctor for your high blood pressure?”; and control is defined as having systolic blood pressure below 130 mm Hg and diastolic blood pressure below 80 mm Hg.
SOURCE: National Center for Health Statistics, National Health and Nutrition Examination Survey, 2017–March 2020 and August 2021–August 2023.
Summary
Nearly 48% of U.S. adults had hypertension during August 2021–August 2023 (47.7%), consistent with 48.1% reported during 2017–March 2020 (3,4). The prevalence of hypertension increased with increasing age, with more than 70% of adults age 60 and older having hypertension.
Hypertension is a treatable chronic condition. Men were more likely than women to have hypertension, but among those with hypertension, a higher percentage of women were aware of their hypertension, reported treatment for hypertension, and had controlled hypertension. The reason for this sex difference may be multifaceted, and research shows that women generally seek health care more than men (5).
Based on recent national data from August 2021 through August 2023, the prevalence of hypertension remains above the Healthy People 2030 target goal to lower blood pressure to 41.9% of the population or below (6). However, the prevalence of controlled hypertension at 20.7% is higher than the Healthy People 2030 target goal of 18.9% or above (7).
Definitions
Hypertension: Systolic blood pressure of 130 mm Hg or above or diastolic blood pressure of 80 mm Hg or above, or currently taking medication to lower blood pressure. This definition is based on criteria from the American College of Cardiology and American Heart Association’s 2017 Hypertension Guideline (8). Previously published National Center for Health Statistics reports have used a higher threshold of 140/90 mm Hg (9,10).
Awareness of hypertension: Among those with hypertension, indicated by a yes response to the survey question, “Have you ever been told by a doctor or health professional that you had hypertension, also called high blood pressure?”
Treatment for hypertension: Among those with hypertension, defined as currently taking medication to lower blood pressure, based on a yes response to the survey question, “Are you now taking any medication prescribed by a doctor for your high blood pressure?” This definition does not include lifestyle modifications for treatment of hypertension.
Controlled hypertension: Among those with hypertension, defined as having systolic blood pressure below 130 mm Hg and diastolic blood pressure below 80 mm Hg.
Data source and methods
Data for this report are from the August 2021–August 2023 National Health and Nutrition Examination Survey, a cross-sectional survey designed to monitor the health and nutritional status of the U.S. civilian noninstitutionalized population (11). The survey is conducted by the Centers for Disease Control and Prevention’s National Center for Health Statistics. The survey sample is selected through a complex, multistage design and consists of interviews conducted in the participant’s home or by phone; a standardized health examination that includes blood pressure measurement in a mobile examination center; and laboratory tests using blood and urine specimens provided during the health examination (12). Unlike previous years, no oversampling was done by race and Hispanic origin or income.
An average of up to three brachial systolic and diastolic blood pressure readings were taken using an oscillometric device. All blood pressure readings were obtained during a participant’s health examination in the mobile examination center by trained staff following a standard protocol (13). Examination sample weights, which account for the differential probabilities of selection, nonresponse, and noncoverage, were incorporated into the estimation process. All variance estimates accounted for the complex survey design using Taylor series linearization. Analyses excluded pregnant women.
Differences between groups were tested using a t statistic at the p < 0.05 significance level. All differences reported are statistically significant unless otherwise indicated. Adjustments were not made for multiple comparisons. Statistical analyses were conducted using the SAS System for Windows (Release 9.4, SAS Institute Inc., Cary, N.C.) and SUDAAN (Release 11.1, RTI International, Research Triangle Park, N.C.).
About the authors
Cheryl D. Fryar, Brian Kit, and Margaret D. Carroll are with the National Center for Health Statistics, Division of Health and Nutrition Examination Surveys. Joseph Afful is a contractor with the Peraton Corporation.
References
- Ostchega Y, Fryar CD, Nwankwo T, Nguyen DT. Hypertension prevalence among adults aged 18 and over: United States, 2017–2018. NCHS Data Brief, no 364. Hyattsville, MD: National Center for Health Statistics. 2020.
- Fuchs FD, Whelton PK. High blood pressure and cardiovascular disease. Hypertension 75(2):285–92. 2020.
- Centers for Disease Control and Prevention. Estimated hypertension prevalence, treatment, and control among U.S. adults. Figure: Hypertension prevalence, treatment and control (blood pressure <130/80 mm Hg) among US adults—Applying the criteria from the American College of Cardiology and American Heart Association’s (ACC/AHA) 2017 hypertension clinical practice guideline—NHANES 2017–March 2020. 2023.
- Stierman B, Afful J, Carroll MD, Chen TC, Davy O, Fink S, et al. National Health and Nutrition Examination Survey 2017–March 2020 prepandemic data files—Development of files and prevalence estimates for selected health outcomes. National Health Statistics Reports; no 158. Hyattsville, MD: National Center for Health Statistics. 2021. DOI: https://dx.doi.org/10.15620/cdc:106273.
- Ashman JJ, Santo L, Okeyode T. Characteristics of office-based physician visits by age, 2019. National Health Statistics Reports; no 184. Hyattsville, MD: National Center for Health Statistics. 2023. DOI: https://dx.doi.org/10.15620/cdc:125462.
- U.S. Department of Health and Human Services. Healthy people 2030: Reduce the proportion of adults with high blood pressure—HDS 04.
- U.S. Department of Health and Human Services. Healthy people 2030: Increase control of high blood pressure in adults—HDS 05.
- Whelton PK, Carey RM, Aronow WS, Casey DE Jr, Collins KJ, Dennison Himmelfarb C, et al. 2017 ACC/AHA/AAPA/ABC/ACPM/AGS/APhA/ASH/ASPC/NMA/PCNA guideline for the prevention, detection, evaluation, and management of high blood pressure in adults: A report of the American College of Cardiology/American Heart Association Task Force on Clinical Practice Guidelines. J Am Coll Cardiol 71(19):e127–248. 2018.
- Yoon SS, Fryar CD, Carroll MD. Hypertension prevalence and control among adults: United States, 2011–2014. NCHS Data Brief, no 220. Hyattsville, MD: National Center for Health Statistics. 2015.
- Nwankwo T, Yoon SS, Burt V, Gu Q. Hypertension among adults in the United States: National Health and Nutrition Examination Survey, 2011–2012. NCHS Data Brief, no 133. Hyattsville, MD: National Center for Health Statistics. 2013.
- National Center for Health Statistics. National Health and Nutrition Examination Survey: NHANES questionnaires, datasets, and related documentation.
- Terry AL, Chiappa MM, McAllister J, Woodwell DA, Graber JE. Plan and operations of the National Health and Nutrition Examination Survey, August 2021–August 2023. National Center for Health Statistics. Vital Health Stat 1(66). 2024. DOI: https://dx.doi.org/10.15620/cdc/151927.
- National Center for Health Statistics. National Health and Nutrition Examination Survey. 2021 blood pressure-oscillometric measurement procedures manual. 2021.
Suggested citation
Fryar CD, Kit B, Carroll MD, Afful J. Hypertension prevalence, awareness, treatment, and control among adults age 18 and older: United States, August 2021–August 2023. NCHS Data Brief, no 511. Hyattsville, MD: National Center for Health Statistics. 2024. DOI:
https://dx.doi.org/10.15620/cdc/164016.
Copyright information
All material appearing in this report is in the public domain and may be reproduced or copied without permission; citation as to source, however, is appreciated.
National Center for Health Statistics
Brian C. Moyer, Ph.D., Director
Amy M. Branum, Ph.D., Associate Director for Science
Division of Health and Nutrition Examination Surveys
Alan E. Simon, M.D., Director
Lara J. Akinbami, M.D., Associate Director for Science