Stroke Death Rates Among Adults Ages 45–64 by Region and Race and Hispanic Origin: United States, 2002–2022
- Key findings
- After declining between 2002 and 2012, the stroke death rate among people ages 45–64 increased through 2021 and then declined in 2022.
- Stroke death rates among men ages 45–64 generally declined during the first half of the period and then increased through 2020–2021 in each region.
- Stroke death rates among women ages 45–64 generally declined in each region during the first half of the period and then increased through 2021–2022.
- Stroke death rates for Black non-Hispanic (subsequently, Black) men were 2 to 3 times higher than for all other race and Hispanic-origin groups in each region.
Data from the National Vital Statistics System
- After a period of decline between 2002 and 2012, the stroke death rate for adults ages 45–64 increased 7% between 2012 (20.2 per 100,000) and 2019 (21.7) and an additional 12% through 2021 (24.4).
- For men, stroke death rates increased in each region from 2012 to 2020, and then rates declined or did not change significantly through 2022.
- For women, stroke death rates increased for all regions from 2012 to 2020 and continued to increase through 2022 in the Northeast.
- Black non-Hispanic (subsequently, Black) men had the highest stroke death rates among men in each region, with the highest rate in the South (65.7).
- Black women had the highest stroke death rates in each region, with rates higher in the Midwest (41.0), South (41.6), and West (45.0) compared with the Northeast (26.9).
Cerebrovascular disease (stroke) is a leading cause of long-term disability and premature death in people ages 45–64 (1,2). There have been persistent disparities in stroke death rates by region of the country as well as by race and Hispanic origin (3,4). This Data Brief presents trends in stroke death rates among people ages 45–64, overall and by sex, for 2002 to 2022. Trends are also presented for men and women by region from 2002 to 2022. For 2022, stroke death rates are presented for men and women by race and Hispanic origin within each region.
Keywords: cerebrovascular disease, death certificate, underlying cause of death, National Vital Statistics System (NVSS)
After declining between 2002 and 2012, the stroke death rate among people ages 45–64 increased through 2021 and then declined in 2022.
- The stroke death rate for adults ages 45–64 declined from 2002 (23.9 per 100,000) to 2012 (20.2) and then increased 7% through 2019 (21.7) and 12% from 2019 to 2021 (24.4), to the highest rate of the period. The rate then declined 2% through 2022 (23.9) (Figure 1, Table 1).
- For men, the stroke death rate declined from 2002 (26.9) to 2012 (23.5) and then increased 10% through 2019 (25.8) and 12% from 2019 to 2020 (28.9), to the highest rate of the period. The rate then declined 2% through 2022 (28.1).
- From 2002 to 2013, the stroke death rate for women declined from 21.1 to 16.6 before increasing 7% through 2019 (17.8) and 13% from 2019 to 2021 (20.2). The rate did not change significantly through 2022.
Figure 1. Stroke death rate among men and women ages 45‒64: United States, 2002‒2022
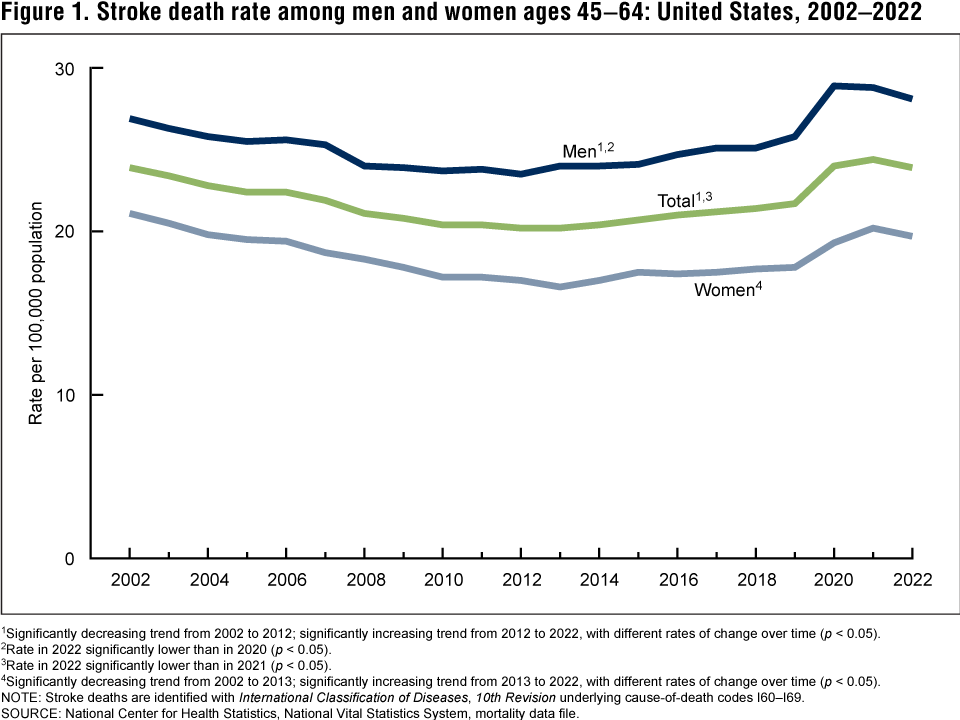
1Significantly decreasing trend from 2002 to 2012; significantly increasing trend from 2012 to 2022, with different rates of change over time (p < 0.05).
2Rate in 2022 significantly lower than in 2020 (p < 0.05).
3Rate in 2022 significantly lower than in 2021 (p < 0.05).
4Significantly decreasing trend from 2002 to 2013; significantly increasing trend from 2013 to 2022, with different rates of change over time (p < 0.05).
NOTE: Stroke deaths are identified with International Classification of Diseases, 10th Revision underlying cause-of-death codes I60–I69.
SOURCE: National Center for Health Statistics, National Vital Statistics System, mortality data file.
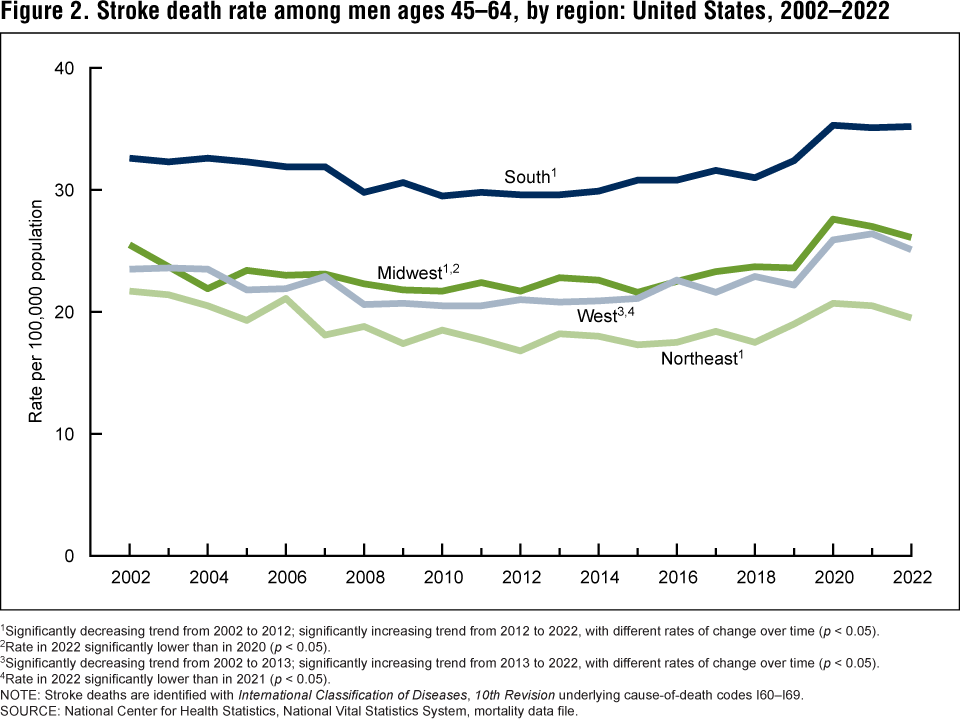
Stroke death rates among men ages 45–64 generally declined during the first half of the period and then increased through 2020–2021 in each region.
- From 2002 to 2022, stroke death rates among men ages 45–64 were the highest in the South and lowest in the Northeast (Figure 2, Table 2).
- The stroke death rate among men in the South declined from 2002 (32.6 per 100,000) to 2012 (29.6) and then increased 9% through 2019 (32.4) and 9% from 2019 to 2020 (35.3). The rate remained stable from 2020 to 2022.
- Stroke death rates for men in the Midwest and West generally fluctuated and declined in the first half of the period and then increased through 2020 in the Midwest and through 2021 in the West. From 2021 to 2022, rates declined in both regions.
- From 2002 to 2012, stroke death rates among men in the Northeast declined and then increased 13% from 2012 (16.8) through 2019 (19.0) and 9% from 2019 to 2020 (20.7). The decline in the rate from 2020 through 2022 was not significant.
- The largest annual increases in stroke death rates for men in each region occurred between 2019 and 2020, ranging from 9% in the Northeast and South to 17% in the Midwest and West.
Figure 2. Stroke death rate among men ages 45–64, by region: United States, 2002–2022
1Significantly decreasing trend from 2002 to 2012; significantly increasing trend from 2012 to 2022, with different rates of change over time (p < 0.05).
2Rate in 2022 significantly lower than in 2020 (p < 0.05).
3Significantly decreasing trend from 2002 to 2013; significantly increasing trend from 2013 to 2022, with different rates of change over time (p < 0.05).
4Rate in 2022 significantly lower than in 2021 (p < 0.05).
NOTE: Stroke deaths are identified with International Classification of Diseases, 10th Revision underlying cause-of-death codes I60–I69.
SOURCE: National Center for Health Statistics, National Vital Statistics System, mortality data file.
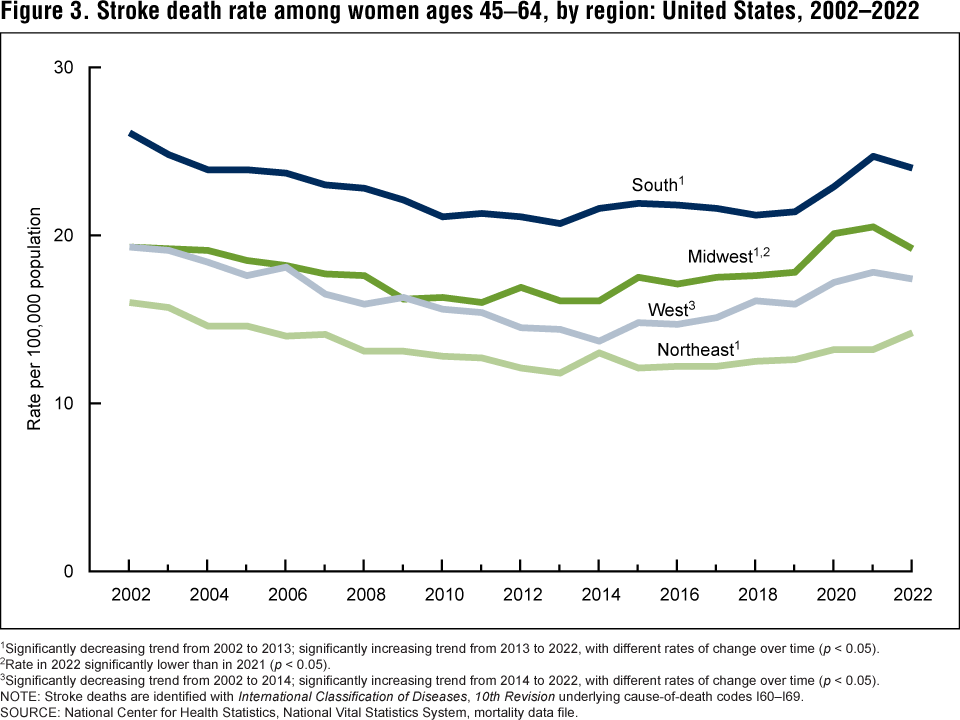
Stroke death rates among women ages 45–64 generally declined in each region during the first half of the period and then increased through 2021–2022.
- From 2002 to 2022, stroke death rates among women ages 45–64 were highest in the South and lowest in the Northeast (Figure 3, Table 3).
- Stroke death rates in the South declined from 2002 (26.1 per 100,000) to 2013 (20.7) and then increased 3% through 2019 (21.4) and 15% from 2019 to 2021 (24.7). The decline in the rate from 2021 to 2022 was not significant.
- Stroke death rates for women in the Midwest and West generally fluctuated and declined in the first half of the period, increased through 2021, and then declined 6% in the Midwest through 2022 but remained stable in the West.
- Among women in the Northeast, stroke death rates initially declined from 2002 (16.0) to 2013 (11.8) and then increased 7% through 2019 (12.6) and 13% from 2019 to 2022 (14.2).
- The largest annual increases in stroke death rates for women in the Midwest and West were from 2019 to 2020 (13% and 8%, respectively). For women in the South, the largest annual percentage increase was from 2020 to 2021 (8%), and in the Northeast, from 2013 to 2014 (10%).
Figure 3. Stroke death rate among women ages 45‒64, by region: United States, 2002–2022
1Significantly decreasing trend from 2002 to 2013; significantly increasing trend from 2013 to 2022, with different rates of change over time (p < 0.05).
2Rate in 2022 significantly lower than in 2021 (p < 0.05).
3Significantly decreasing trend from 2002 to 2014; significantly increasing trend from 2014 to 2022, with different rates of change over time (p < 0.05).
NOTE: Stroke deaths are identified with International Classification of Diseases, 10th Revision underlying cause-of-death codes I60–I69.
SOURCE: National Center for Health Statistics, National Vital Statistics System, mortality data file.
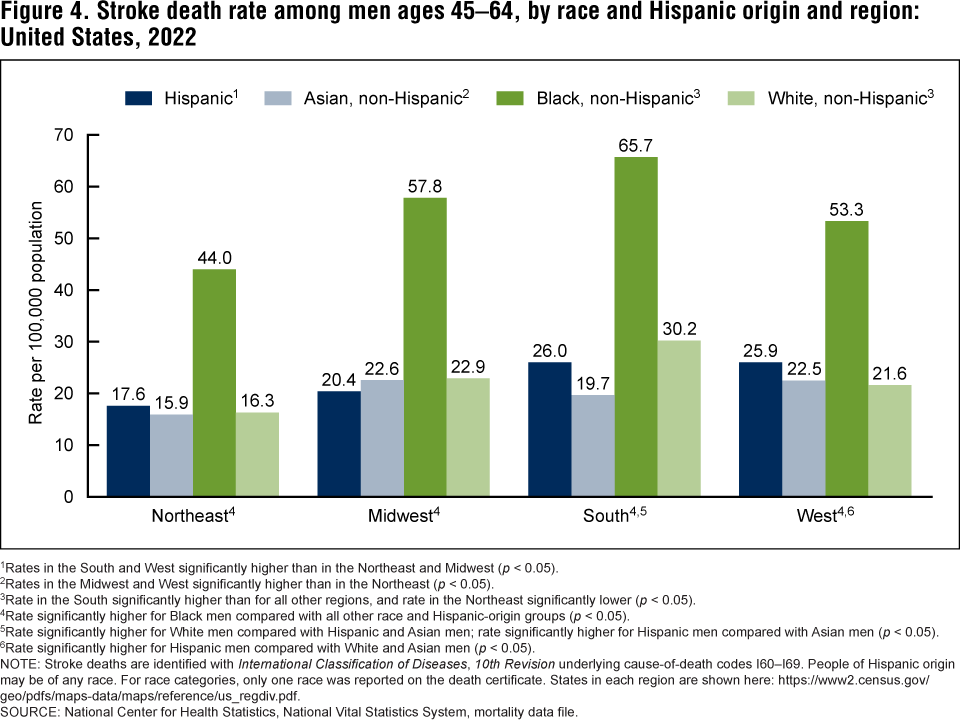
Stroke death rates for Black non-Hispanic (subsequently, Black) men were 2 to 3 times higher than for all other race and Hispanic-origin groups in each region.
- In each region, Black men had the highest rates of stroke death, with the lowest rate in the Northeast (44.0 per 100,000) and the highest rate in the South (65.7) (Figure 4, Table 4).
- In the Northeast, stroke death rates for Hispanic, Asian non-Hispanic (subsequently, Asian), and White non-Hispanic (subsequently, White) men were similar and the lowest of all regions (17.6, 15.9, and 16.3, respectively).
- Stroke death rates in the Midwest were similar for Hispanic (20.4), Asian (22.6), and White (22.9) men.
- The stroke death rate for White men was highest in the South (30.2) and higher compared with Hispanic (26.0) and Asian (19.7) men. The highest rates for Hispanic men were in the South (26.0) and West (25.9).
- In the West, stroke death rates were similar for White (21.6) and Asian (22.5) men, and both rates were lower compared with Hispanic men (25.9).
Figure 4. Stroke death rate among men ages 45‒64, by race and Hispanic origin and region: United States, 2022
1Rates in the South and West significantly higher than in the Northeast and Midwest (p < 0.05).
2Rates in the Midwest and West significantly higher than in the Northeast (p < 0.05).
3Rate in the South significantly higher than for all other regions, and rate in the Northeast significantly lower (p < 0.05).
4Rate significantly higher for Black men compared with all other race and Hispanic-origin groups (p < 0.05).
5Rate significantly higher for White men compared with Hispanic and Asian men; rate significantly higher for Hispanic men compared with Asian men (p < 0.05).
6Rate significantly higher for Hispanic men compared with White and Asian men (p < 0.05).
NOTES: Stroke deaths are identified with International Classification of Diseases, 10th Revision underlying cause-of-death codes I60–I69. People of Hispanic origin may be of any race. For race categories, only one race was reported on the death certificate. States in each region are shown here: https://www2.census.gov/geo/pdfs/maps-data/maps/reference/us_regdiv.pdf.
SOURCE: National Center for Health Statistics, National Vital Statistics System, mortality data file.
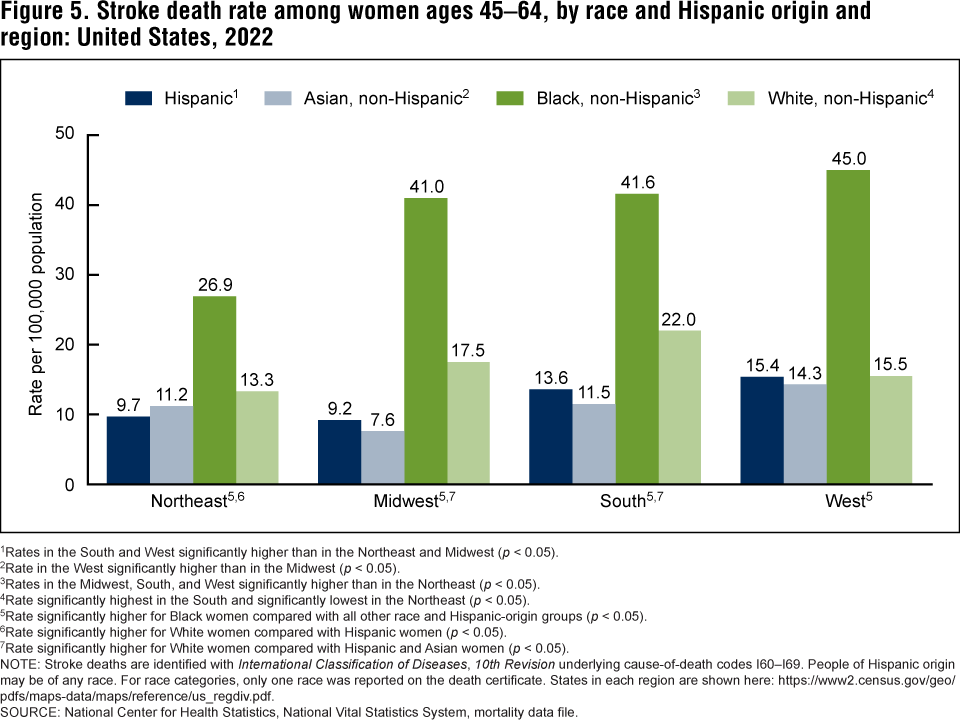
In each region in 2022, stroke death rates for Black women ranged from 2 to 5 times higher than for all other race and Hispanic-origin groups.
- Stroke death rates in each region were highest for Black women, whose rates were similar in the West (45.0 per 100,000), South (41.6), and Midwest (41.0), and lowest in the Northeast (26.9) (Figure 5, Table 5).
- The stroke death rate for White women was highest in the South (22.0), where it was higher than for Asian (11.5) and Hispanic (13.6) women.
- In the Midwest, White women (17.5) had higher stroke death rates compared with Hispanic (9.2) and Asian (7.6) women.
- Both Asian and Hispanic women had higher stroke death rates in the West (14.3 and 15.4, respectively) compared with the Midwest (7.6 and 9.2, respectively).
- Stroke death rates were lowest in the Northeast and Midwest for Hispanic women, and in the Northeast for Black and White women.
Figure 5. Stroke death rate among women ages 45‒64, by race and Hispanic origin and region: United States, 2022
1Rates in the South and West significantly higher than in the Northeast and Midwest (p < 0.05).
2Rate in the West significantly higher than in the Midwest (p < 0.05).
3Rates in the Midwest, South, and West significantly higher than in the Northeast (p < 0.05).
4Rate significantly highest in the South and significantly lowest in the Northeast (p < 0.05).
5Rate significantly higher for Black women compared with all other race and Hispanic-origin groups (p < 0.05).
6Rate significantly higher for White women compared with Hispanic women (p < 0.05).
7Rate significantly higher for White women compared with Hispanic and Asian women (p < 0.05).
NOTES: Stroke deaths are identified with International Classification of Diseases, 10th Revision underlying cause-of-death codes I60–I69. People of Hispanic origin may be of any race. For race categories, only one race was reported on the death certificate. States in each region are shown here: https://www2.census.gov/geo/pdfs/maps-data/maps/reference/us_regdiv.pdf.
SOURCE: National Center for Health Statistics, National Vital Statistics System, mortality data file.
Summary
After declines between 2002 and 2012, stroke death rates among men and women ages 45–64 increased starting around 2013 and continued to increase through 2020 for men and 2021 for women. This increase is consistent with recent trends in stroke prevalence, which increased 15.7% from 2011–2013 to 2020–2022 for people ages 45–64 (5). Although the increases in stroke death rates started pre-COVID, the percentage increases in the rates were greater after 2019. The rate then declined for men and remained statistically unchanged for women through 2022. This same general trend was observed for men and women in each region of the country, although rates for women in the Northeast continued to increase through 2022. For men in all groups in each region, the largest 1-year increase in stroke death rates was from 2019 to 2020. Throughout the period, the highest stroke death rates for both men and women were in the South, and the lowest were in the Northeast.
In each region, differences in stroke death rates by race and Hispanic origin were seen, as Black men and women had rates that were at least twice those of all other groups. White men and women and Black men had their highest stroke death rates in the South compared with all other regions, whereas rates for Black women were higher in the South, Midwest, and West compared with the Northeast. Rates were similar among Asian, White, and Hispanic people in some regions, but this differed by sex.
Race and ethnicity
This report features data for four race and Hispanic-origin groups (Asian non-Hispanic, Black non-Hispanic, White non-Hispanic, and Hispanic) who had at least 20 stroke deaths in men and women in all regions to compute reliable rates. Among people aged 45–64 in 2022, these four groups comprised 98% of all stroke deaths for men and 97% for women. Data are not shown for American Indian and Alaska Native non-Hispanic and Native Hawaiian and Other Pacific Islander non-Hispanic people. Information on race and Hispanic origin is from death certificates and supplied by an informant, usually the next of kin. Race and Hispanic origin are two distinct attributes and are reported separately on death certificates. Therefore, the data shown in this report by Hispanic origin and race are based on a combination of the two attributes for the non-Hispanic population. Data shown for the Hispanic population include adults of any race.
Death rates for Hispanic and Asian people are impacted by inconsistencies in reporting Hispanic origin and race on the death certificate compared with censuses and surveys. A validity study has shown underreporting on death certificates of Hispanic and Asian decedents by 3% (10). Rates in this report for 2002–2017 are based on multiple-race mortality data that were bridged to single-race categories based on the 1977 Office of Management and Budget standards for the classification of race and ethnicity. Rates for 2018–2022 were based on the 1997 Office of Management and Budget standards and might differ slightly from those based on the 1977 standards (11).
Definition
Region: Defined by the U.S. Census Bureau.
- Northeast: Connecticut, Maine, Massachusetts, New Hampshire, New Jersey, New York, Pennsylvania, Rhode Island, and Vermont
- Midwest: Illinois, Indiana, Iowa, Kansas, Michigan, Minnesota, Missouri, Nebraska, North Dakota, Ohio, South Dakota, Wisconsin
- South: Alabama, Arkansas, Delaware, District of Columbia, Florida, Georgia, Kentucky, Louisiana, Maryland, Mississippi, North Carolina, Oklahoma, South Carolina, Tennessee, Texas, Virginia, and West Virginia
- West: Alaska, Arizona, California, Colorado, Hawaii, Idaho, Montana, Nevada, New Mexico, Oregon, Utah, Washington, and Wyoming
Data source and methods
Mortality data for 2002–2017 are from the National Center for Health Statistics’ 1999–2020 Underlying Cause of Death by Bridged-Race Categories, and data for 2018–2022 are from the 2018–2022 Underlying Cause of Death by Single-Race Categories (6). Population data are from the Census Bureau and for 2002–2009 are based on July 1 intercensal estimates, and for 2011–2020 are July 1 postcensal estimates based on the 2020 census. Population estimates for 2021 and 2022 are estimated as of July 1 based on the Blended Base produced by the U.S. Census Bureau in the place of the April 1, 2020, decennial population count. The Blended Base consists of the blend of Vintage 2020 postcensal population estimates, 2020 Demographic. Analysis Estimates, and 2020 Census PL 94–171 Redistricting File (7). Stroke deaths are those with International Classification of Diseases, 10th Revision underlying cause-of-death codes I60–I69 (8).
Trends in Figures 1–3 were evaluated using the Joinpoint Regression Program (9). Joinpoint software was used to fit weighted least-squares regression models to the estimated proportions on the logarithmic scale. The default settings allowed for as few as three observed time points in the beginning, ending, and middle line segments, including the joinpoints. Using these settings, a maximum of three joinpoints were searched for using the grid search algorithm and permutation test, and an overall alpha level of 0.05. Pairwise comparisons of rates in Figures 1–5 were tested using the z test statistic at p < 0.05.
About the authors
Sally C. Curtin is with the National Center for Health Statistics, Division of Vital Statistics.
References
- Tsao CW, Aday AW, Almarzooq ZI, Anderson CAM, Arora P, Avery CL, et al. Heart disease and stroke statistics—2023 update: A report from the American Heart Association. Circulation 147(8):e93–621. 2023.
- Curtin SC, Tejada-Vera B, Bastian BA. Deaths: Leading causes for 2020. National Vital Statistics Reports; vol 72 no 13. Hyattsville, MD: National Center for Health Statistics. 2023. DOI: https://dx.doi.org/10.15620/cdc:133059.
- Howard G, Howard VJ. Twenty years of progress toward understanding the stroke belt. Stroke 51(3):742–50. 2020.
- Bonow RO, Grant AO, Jacobs AK. The cardiovascular state of the union: Confronting healthcare disparities. Circulation 111(10):1205–7. 2005. DOI: https://doi.org/10.1161/01.CIR.0000160705.97642.92.
- Imoisili OE, Chung A, Tong X, Hayes DK, Loustalot F. Prevalence of stroke — Behavioral Risk Factor Surveillance System, United States, 2011–2022. MMWR Morb Mortal Wkly Rep 73(20):449–55. 2024. DOI: https://dx.doi.org/10.15585/mmwr.mm7320a1.
- National Center for Health Statistics. CDC WONDER. 1999–2020 Underlying Cause of Death by Bridged-Race Categories and 2018–2021 Underlying Cause of Death by Single-Race Categories. 2023.
- U.S. Census Bureau. Methodology for the United States population estimates: Vintage 2021 nation, states, counties, and Puerto Rico–April 1, 2020 to July 1, 2021. 2021.
- World Health Organization. International statistical classification of diseases and related health problems, 10th revision (ICD–10). 2008 ed. 2009.
- National Cancer Institute. Joinpoint Regression Program (Version 4.9.0.0) [computer software]. 2021.
- Arias E, Heron M, Hakes JK. The validity of race and Hispanic-origin reporting on death certificates in the United States: An update. National Center for Health Statistics. Vital Health Stat 2(172). 2016.
- Heron M. Comparability of race-specific mortality data based on 1977 versus 1997 reporting standards. National Vital Statistics Reports; vol 70 no 3. Hyattsville, MD: National Center for Health Statistics. 2021. DOI: https://dx.doi.org/10.15620/cdc:103476.
Suggested citation
Curtin SC. Stroke death rates among adults ages 45–64 by region and race and Hispanic origin: United States, 2002–2022. NCHS Data Brief, no 505. Hyattsville, MD: National Center for Health Statistics. 2024. DOI: https://dx.doi.org/10.15620/cdc/158326.
Copyright information
All material appearing in this report is in the public domain and may be reproduced or copied without permission; citation as to source, however, is appreciated.
National Center for Health Statistics
Brian C. Moyer, Ph.D., Acting Director
Amy M. Branum, Ph.D., Associate Director for Science
Division of Vital Statistics
Paul D. Sutton, Ph.D., Acting Director
Andrés A. Berruti, Ph.D., M.A., Associate Director for Science