Prevalence of Prescription Pain Medication Use Among Adults: United States, 2015–2018
- Key findings
- What percentage of U.S. adults used one or more prescription pain medications in the past 30 days in 2015–2018, and did use differ by age and sex?
- Did prescription pain medication use in the past 30 days differ by sex and race and Hispanic origin in 2015–2018?
- What percentage of U.S. adults used one or more prescription opioid pain medications in the past 30 days in 2015–2018, and did use differ by sex, age, and race and Hispanic origin?
- What percentage of U.S. adults used one or more nonopioid prescription pain medications without prescription opioids in the past 30 days in 2015–2018, and did use differ by sex, age, and race and Hispanic origin?
- What are the trends in the use of one or more prescription opioids and nonopioid prescription pain medications (without prescription opioids) among adults?
- Summary
- Definitions
- Data source and methods
- About the authors
- References
- Suggested citation
PDF Version (416 KB) | Visual Abstract
Key findings
Data from the National Health and Nutrition Examination Survey
- In 2015–2018, 10.7% of U.S. adults aged 20 and over used one or more prescription pain medications (opioid or nonopioid) in the past 30 days.
- In 2015–2018, 5.7% of U.S. adults used one or more prescription opioids.
- Prescription opioid use was higher among women than men, and use increased with age.
- In 2015–2018, 5.0% of adults used nonopioid prescription pain medications without prescription opioids in the past 30 days; use was lowest among non-Hispanic Asian adults.
- From 2009–2010 through 2017–2018, no significant change in the use of prescription opioids was seen, but use of nonopioid prescription pain medications (without prescription opioids) increased.
Prescription pain medications are used to treat pain due to injury, surgery, and health conditions, such as arthritis and cancer. While opioids may be prescribed together with nonopioid pain medications, nonpharmacologic and nonopioid-containing pharmacologic therapies are preferred for management of chronic pain, where appropriate (1). This report shows the percentage of U.S. adults who, in the past 30 days, used one or more prescription pain medications, used prescription opioid medications, or used nonopioid prescription pain medications (without prescription opioids) in 2015–2018.
Keywords: analgesic, drug, opioid, NHANES
What percentage of U.S. adults used one or more prescription pain medications in the past 30 days in 2015–2018, and did use differ by age and sex?
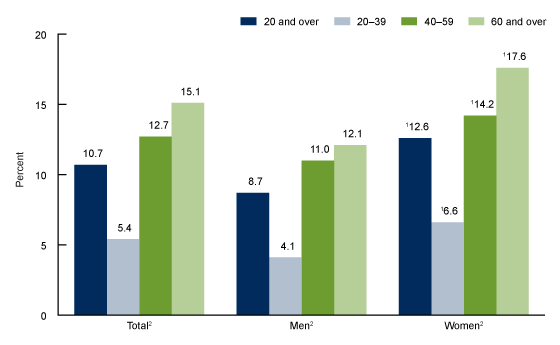
In 2015–2018, 10.7% of U.S. adults used one or more prescription pain medications in the past 30 days (Figure 1). Use increased with age, from 5.4% among adults aged 20–39 to 12.7% for those aged 40–59 to 15.1% for those aged 60 and over. Prescription pain medication use was higher among women (12.6%) compared with men (8.7%) overall and in all age groups. Prescription pain medication use increased with age among both men and women.
Figure 1. Use of prescription pain medications in the past 30 days among adults aged 20 and over, by sex and age: United States, 2015–2018
1Significantly different from men.
2Significantly increasing trend with age.
NOTE: Access data table for Figure 1.
SOURCE: NCHS, National Health and Nutrition Examination Survey, 2015–2018.
Did prescription pain medication use in the past 30 days differ by sex and race and Hispanic origin in 2015–2018?
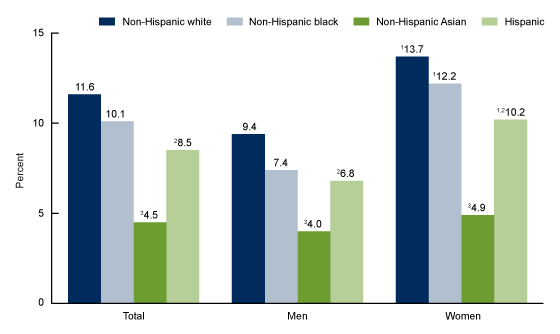
Among all adults, prescription pain medication use was lowest among non-Hispanic Asian adults (4.5%) (Figure 2). Use was higher among non-Hispanic white (11.6%) than Hispanic (8.5%) adults, but use among both groups did not differ significantly from non-Hispanic black adults (10.1%). A similar pattern of race and Hispanic-origin differences was observed among men and women.
Prescription pain medication use was higher among women than among men for non-Hispanic white (13.7% compared with 9.4%), non-Hispanic black (12.2% compared with 7.4%), and Hispanic (10.2% compared with 6.8%) adults.
Figure 2. Use of prescription pain medications in the past 30 days among adults aged 20 and over, by sex and race and Hispanic origin: United States, 2015–2018
1Significantly different from men of same race and Hispanic origin.
2Significantly different from non-Hispanic white adults.
3Significantly different from all other race and Hispanic-origin groups.
NOTE: Access data table for Figure 2.
SOURCE: NCHS, National Health and Nutrition Examination Survey, 2015–2018.
What percentage of U.S. adults used one or more prescription opioid pain medications in the past 30 days in 2015–2018, and did use differ by sex, age, and race and Hispanic origin?
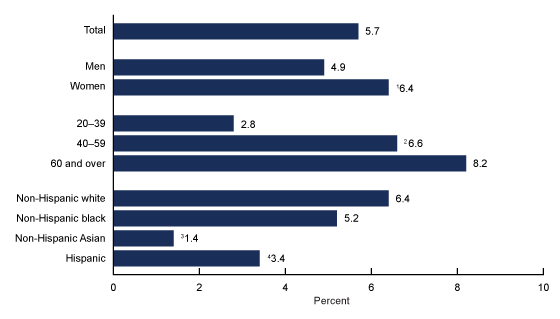
In 2015–2018, 5.7% of U.S. adults used one or more prescription opioids in the past 30 days (Figure 3). Use among women (6.4%) was higher than among men (4.9%), and use increased with age, from 2.8% among adults aged 20–39 to 6.6% for those aged 40–59 to 8.2% for those aged 60 and over. Use among non-Hispanic Asian adults (1.4%) was lowest among all race and Hispanic-origin groups. Use of prescription opioids was lower among Hispanic adults (3.4%) compared with non-Hispanic white adults (6.4%) and non-Hispanic black adults (5.2%).
Figure 3. Use of prescription opioids in the past 30 days among adults aged 20 and over, by sex, age, and race and Hispanic origin: United States, 2015–2018
1Significantly different from men.
2Significantly increasing trend with age.
3Significantly different from all other race and Hispanic-origin groups.
4Significantly different from non-Hispanic white and non-Hispanic black adults.
NOTES: Prescription opioid use was defined as using one or more prescription opioids with or without other nonopioid prescription pain medications. Access data table for Figure 3.
SOURCE: NCHS, National Health and Nutrition Examination Survey, 2015–2018.
What percentage of U.S. adults used one or more nonopioid prescription pain medications without prescription opioids in the past 30 days in 2015–2018, and did use differ by sex, age, and race and Hispanic origin?
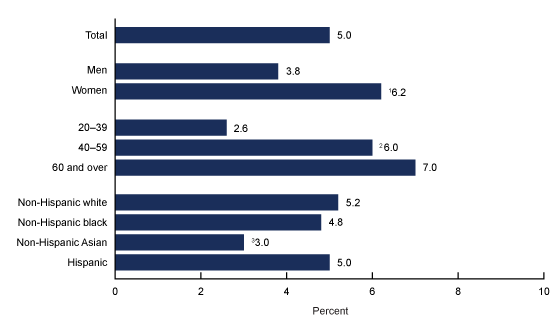
In 2015–2018, 5.0% of U.S. adults used one or more nonopioid prescription pain medications without prescription opioids in the past 30 days (Figure 4). Use was higher among women (6.2%) than among men (3.8%), and use increased with age, from 2.6% among adults aged 20–39 to 6.0% for those aged 40–59 to 7.0% for those aged 60 and over. Use was lowest among non-Hispanic Asian adults (3.0%) compared with all other race and Hispanic-origin groups. Use among non-Hispanic white (5.2%), non-Hispanic black (4.8%), and Hispanic (5.0%) adults did not differ.
Figure 4. Use of nonopioid prescription pain medications without prescription opioids in the past 30 days among adults aged 20 and over, by sex, age, and race and Hispanic origin: United States, 2015–2018
1Significantly different from men.
2Significantly increasing trend with age.
3Significantly different from all other race and Hispanic-origin groups.
NOTES: Use of nonopioid prescription pain medications (without prescription opioids) was defined as using one or more nonopioid prescription pain medications without any use of prescription opioids. Access data table for Figure 4.
SOURCE: NCHS, National Health and Nutrition Examination Survey, 2015–2018.
What are the trends in the use of one or more prescription opioids and nonopioid prescription pain medications (without prescription opioids) among adults?
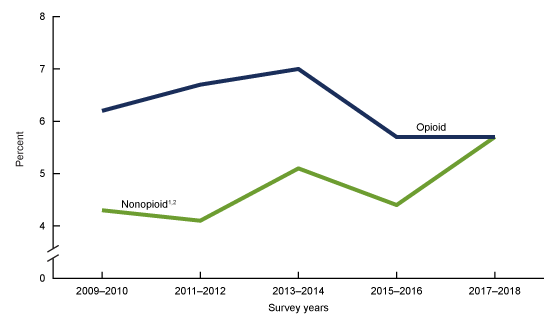
Between 2009–2010 and 2017–2018, no significant trend in the use of prescription opioids was observed; however, an increasing trend in the use of nonopioid prescription pain medications without prescription opioids was seen, from 4.3% in 2009–2010 to 5.7% in 2017–2018 (Figure 5). Between 2015–2016 and 2017–2018, use of prescription opioids remained the same (5.7%), but use of nonopioid prescription pain medications (without prescription opioids) increased from 4.4% to 5.7%.
Figure 5. Use of prescription opioids and nonopioid prescription pain medications (without prescription opioids) in the past 30 days among adults aged 20 and over: United States, 2009–2010 through 2017–2018
1Significant linear trend.
2Significant difference between 2015–2016 and 2017–2018.
NOTES: Prescription opioid use was defined as using one or more prescription opioids with or without nonopioid prescription pain medications. Use of nonopioid prescription pain medications (without prescription opioids) was defined as using one or more nonopioid prescription pain medications without any use of prescription opioids. Access data table for Figure 5.
SOURCE: NCHS, National Health and Nutrition Examination Survey, 2009–2018.
Summary
In 2015–2018, 10.7% of U.S. adults used one or more prescription pain medications in the past 30 days. Prescription pain medication use was higher among women than men overall and within each age category. Use increased with age overall and among both men and women. Prescription pain medication use was lowest among non-Hispanic Asian adults, and use among Hispanic adults was lower than among non-Hispanic white adults. This same pattern of prescription pain medication use was observed in both men and women.
Additionally, this report estimated the percentage of adults who used one or more opioid prescription pain medications (with or without use of nonopioid prescription pain medications) and the percentage who used one or more nonopioid prescription pain medications (without prescription opioids). In 2015–2018, 5.7% of U.S. adults used prescription opioids, and 5.0% used nonopioid prescription pain medications (without prescription opioids) in the past 30 days. Use of one or more prescription opioids and use of nonopioid prescription pain medications (without prescription opioids) was higher among women than men and increased with age; use was lowest among non-Hispanic Asian adults. Use of one or more prescription opioids among Hispanic adults was lower than among non-Hispanic white adults.
From 2009–2010 through 2017–2018, no significant increase in the use of prescription opioids was seen, but the use of nonopioid prescription pain medications (without prescription opioids) increased.
Definitions
Prescription pain medication use: : Participants were asked if they had taken a prescription medication in the past 30 days. Those who answered “yes” were asked to show the interviewer the medication containers of all prescription medications (2). For each drug reported, the interviewer recorded the product’s complete name from the container, if available. Prescription medications were classified based on the therapeutic classification scheme of Cerner Multum’s Lexicon (3). Prescription pain medication use was defined as using one or more prescription opioids or nonopioid pain medications or any medication classified as “analgesics–unspecified.”
Prescription opioids: Prescription opioids were identified using the Multum drug category codes 60 (narcotic analgesics) and 191 (narcotic analgesic combinations). Medications containing buprenorphine, which are primarily used to treat opioid addiction, and opioid combinations formulated for treatment of upper respiratory infections were excluded. Prescription opioid use was defined as using one or more prescription opioids with or without other nonopioid prescription pain medications.
Nonopioid prescription pain medications (without prescription opioids): Nonopioid prescription pain medications were identified using the Multum drug category codes 63 (analgesic combinations), 193 (antimigraine agents), 278 (COX-2 inhibitors), 61 (nonsteroidal anti-inflammatory agents), and 62 (salicylates). Medications containing aspirin as a single ingredient are typically used for cardiovascular disease prevention and were excluded. Certain antidepressants and anticonvulsants may also be used for some types of pain, but were excluded because of their broader indications. Use of nonopioid prescription pain medications (without prescription opioids) was defined as using one or more nonopioid prescription pain medications without any use of prescription opioids.
Data source and methods
The National Health and Nutrition Examination Survey (NHANES) is a cross-sectional survey designed to provide nationally representative estimates of the noninstitutionalized population of the United States and is conducted by the National Center for Health Statistics (4). The survey consists of home interviews followed by standardized physical examinations in mobile examination centers. NHANES samples are selected through a complex, multistage probability design, and interview sample weights—which account for the differential probabilities of selection, nonresponse, and noncoverage—are incorporated into the estimation process. Standard errors were estimated by Taylor series linearization, which accounts for the design features of the survey. Pair-wise differences in the prevalence of prescription drug use were tested using a univariate t statistic. Trends were evaluated using logistic regression, with the survey cycle as a continuous independent variable. All differences reported are statistically significant at p < 0.05 unless otherwise indicated. Data management and statistical analyses were conducted using R version 3.5.2 (R Foundation for Statistical Computing, Vienna, Austria), including the R survey package (5), SAS System for Windows version 9.4 (SAS Institute, Inc., Cary, N.C.), and SUDAAN version 11.0 (RTI International, Research Triangle Park, N.C.).
About the authors
Craig M. Hales, Crescent B. Martin, and Qiuping Gu are with the National Center for Health Statistics, Division of Health and Nutrition Examination Surveys.
References
- Dowell D, Haegerich TM, Chou R. CDC guideline for prescribing opioids for chronic pain—United States, 2016. MMWR Recomm Rep 65(1):1–49. 2016.
- National Center for Health Statistics. National Health and Nutrition Examination Survey 2017–2018 data documentation, codebook, and frequencies: Prescription medications.
- National Center for Health Statistics. National Health and Nutrition Examination Survey 1988–2018 data documentation, codebook, and frequencies: Prescription medications—Drug information.
- National Center for Health Statistics. National Health and Nutrition Examination Survey: Questionnaires, datasets, and related documentation.
- Lumley T. Survey: Analysis of complex survey samples. R package version 3.35–1. 2019.
Suggested citation
Hales CM, Martin CB, Gu Q. Prevalence of prescription pain medication use among adults: United States, 2015–2018. NCHS Data Brief, no 369. Hyattsville, MD: National Center for Health Statistics. 2020.
Copyright information
All material appearing in this report is in the public domain and may be reproduced or copied without permission; citation as to source, however, is appreciated.
National Center for Health Statistics
Brian C. Moyer, Ph.D., Director
Amy M. Branum, Ph.D., Acting Associate Director for Science
Division of Health and Nutrition Examination Surveys
Ryne Paulose-Ram, M.A., Ph.D., Acting Director
Lara J. Akinbami, M.D., Acting Associate Director for Science
