 |
|
|
|
|
|
|
| ||||||||||
|
|
|
|
|
|
|
||||
| ||||||||||
|
|
|
|
|
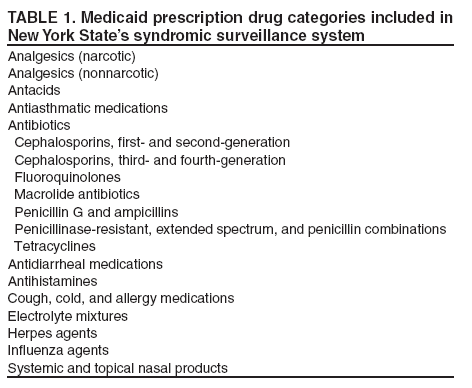
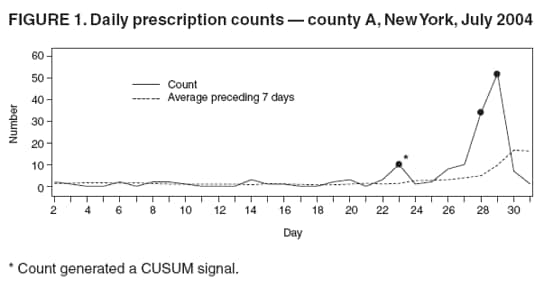
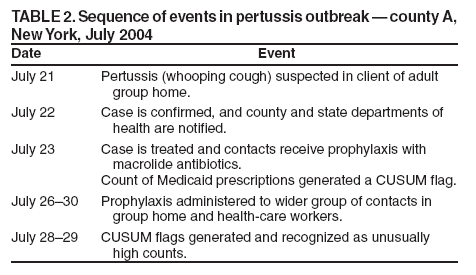
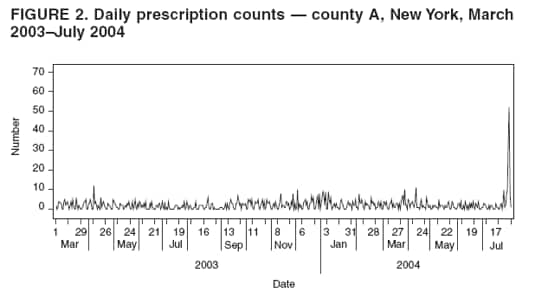
Persons using assistive technology might not be able to fully access information in this file. For assistance, please send e-mail to: mmwrq@cdc.gov. Type 508 Accommodation and the title of the report in the subject line of e-mail. Use of Medicaid Prescription Data for Syndromic Surveillance --- New YorkJian-Hua Chen, K. Schmit, H. Chang, E. Herlihy, J. Miller, P. Smith Corresponding author: Jian-Hua Chen, New York State Department of Health, Rm. 503, Corning Tower, Empire State Plaza, Albany, NY 12237. Telephone: 518-474-4394; Fax: 518-473-2301; E-mail: jhc04@health.state.ny.us. Disclosure of relationship: The contributors of this report have disclosed that they have no financial interest, relationship, affiliation, or other association with any organization that might represent a conflict of interest. In addition, this report does not contain any discussion of unlabeled use of commercial products or products for investigational use. AbstractIntroduction: This study explored the utility and value of Medicaid prescription data for statewide syndromic surveillance. Methods: Daily Medicaid claims forms are transmitted to the New York State Syndromic Surveillance Project as summary counts by ZIP Code, age category, sex, and 18 medication groups. The CUSUM statistic is used to analyze the data daily at the county level with a 7--10-day moving average baseline. The system was evaluated following an outbreak of pertussis in a small institutional setting in a rural county by comparing the county's CUSUM signals for prescriptions for macrolide antibiotics with the onset of the outbreak. Results: A case of pertussis was suspected on July 21, 2004, and was reported to the New York State Department of Health on July 22. Treatment and prophylaxis were initiated on July 22. CUSUM analysis flagged a county-wide increase in macrolide antibiotics on the day of treatment/prophylaxis for the first case and contacts in the outbreak. The following week, approximately 300 contacts received prophylaxis (not all of whom were Medicaid clients), resulting in CUSUM signals during the week (July 28 and 29). Conclusion: Medicaid prescription data are routinely collected and readily available for syndromic surveillance. This data source has shown potential value as an indicator of disease activity, as in this case study, in an area where a high concentration of Medicaid recipients reside. However, for the surveillance system to be considered a useful early warning system, additional study is required to determine the best methods for selecting from the automatically generated CUSUM signals those that might be important for public health. IntroductionThe New York State (NYS) Medicaid Program provides health-care coverage for 34% of the population in New York City and 4%--20% of the populations in the 57 counties in the rest of the state. Enrollees in the Medicaid Program receive approximately 30% of prescriptions filled in NYS. Medicaid activity is concentrated in New York City. However, except for the most sparsely populated areas of upstate NYS, Medicaid enrollees are widely distributed throughout urban, suburban, and rural communities in the rest of the state. Pharmaceutical data have long been used to monitor the public health (1). Recent examples include over-the-counter (OTC) drug sales at pharmacies and groceries (2--4) and prescriptions for specific populations, such as members of the military (5). This case study demonstrates the use of Medicaid records of pharmaceutical activity for syndromic surveillance. MethodsThe New York State Department of Health (NYSDOH) uses an electronic system (eMedNY) for Medicaid management, with a subsystem for reimbursement of prescriptions and OTC medications. The Syndromic Surveillance Project office receives a daily dataset consisting of the number of prescriptions filled in 18 drug categories (Table 1), aggregated by the ZIP code of residence, age group, and sex of the patient. Every day since March 2003, approximately 20,000 records have been transmitted to the Syndromic Surveillance Project office. Approximately 95% of records are for prescriptions filled during the preceding 24--48 hours. The CUSUM statistic, a measure of how much higher a current observation is than a reference baseline, compares each day's volume with a short-term historic baseline (7--10-day moving average as used in the CDC model) (6). Every day, CUSUM-flagged observations are examined by state staff for indications that they might represent an acute disease outbreak. Staff consider the recent and long-term trends of the daily observations in assessing each flagged observation by comparison with previous highest levels or weekly, monthly, or seasonal cycles in prescription activity. This case study compares county-level CUSUM signals for prescriptions for macrolide antibiotics with timing of events in a pertussis outbreak in a rural county in July 2004. In addition, for purposes of comparison, the number of counties in upstate NYS with and without CUSUM signals for high levels of macrolide antibiotic prescriptions was compared with the number of each county's pertussis cases reported by local health departments to NYSDOH's Confidential Case Reports database. ResultsA case of pertussis was reported on July 22, 2004, in a rural county of upstate NYS (county A).The next day, the patient was treated, contacts were administered prophylaxis with macrolide antibiotics, and the Vaccine Preventable Disease Surveillance Officer at NYSDOH was notified. Several persons administered the antibiotics were residents of a group home for mentally retarded adults with Medicaid health-care coverage. These prescriptions generated a macrolide antibiotic CUSUM signal in the Medicaid data for July 23 (n = 10). The following week, additional contacts were administered prophylaxis, and signals were generated on July 28 (n = 34) and 29 (n = 52) (Figure 1 and Table 2). Overall, 13 persons in county A had a polymerase chain reaction that was positive for Bordetella pertussis. During July 23--30, according to the county health department, approximately 300 persons received prophylactic treatment with macrolides; the Medicaid surveillance system detected 125 prescriptions (the patients receiving treatment plus approximately one third of all persons receiving prophylaxis treated). The count of 10 prescriptions on July 23 was high for the short term but not unusually high for the preceding year (Figure 2). Staff did not identify the count of July 23 as unusual for routine follow-up. The CUSUM signals of July 28 and 29 were immediately brought to the attention of epidemiology staff, who confirmed that a number of cases had been identified and that an investigation was ongoing. During July 2004, a total of 90 CUSUM signals for macrolide antibiotics were generated in 37 of the 57 counties of upstate NYS. Of the 90 signals, 54 (60%) were generated by counts higher than a very small (<3) daily baseline average. During the same month, outbreaks were identified and reported through normal surveillance in 10 counties. The Medicaid prescription data generated CUSUM signals for five of these 10 counties in July 2004, but those counties that did have signals had a higher disease rate for the month than the counties without signals (mean: 8.9 versus 3.5 cases per 100,000 population; p<0.0001), even though the percentage of total population enrolled in Medicaid was lower in the counties with signals (mean: 11.7 versus 15.3; p<0.0001). For detecting county-level pertussis outbreaks during July 2004, the Medicaid prescription data for macrolide antibiotics had a sensitivity of 5/10 = 0.5 and a specificity of 15/47 = 0.32. DiscussionNYS experience in using Medicaid pharmaceutical data contributes to the experience with early detection surveillance systems. In this case study, the surveillance system identified an outbreak that had already been reported to NYSDOH; therefore, its warning was not early. The value of this example is in demonstrating that a subset of the CUSUM signals can be linked to disease outbreaks (for pertussis in July 2004, sensitivity = 50%). If the same number of Medicaid recipients in county A had received macrolides without a specific cause already having been identified, notification of the increase by NYSDOH to the county local health department (LHD) should have initiated investigations of the cause. The next challenge is to discover the best methods for selecting from the automatically generated signals those that are most likely to be early or real-time indicators of disease activity. This sort of alert could be useful for early detection of disease outbreaks (natural or intentional) not yet recognized by public health agencies. For example, NYSDOH notified LHD of an increase in Medicaid prescriptions in the category "Influenza Agents" in another rural NYS county in early spring 2005. Investigation by LHD resulted in early notification of a small outbreak. Another benefit of Medicaid pharmaceutical data is the availability of the ZIP code of the patient's residence. When county-wide increases in prescriptions are noted, the distribution by ZIP code of recent prescription claims might help in identifying an outbreak. However, in the pertussis outbreak in county A, the residences of persons receiving prophylaxis were spread out over a wide area, and no clustering was found. A limitation of the Medicaid prescription CUSUM analyses is the generation of a large number of falsepositive signals for disease outbreaks (in July 2004, 32 signals for increased prescriptions for macrolide antibiotics were not linked to any known outbreaks). Furthermore, drugs for less specific uses might generate positive signals without being linked to increased incidence of a particular disease. Users of the CUSUM analyses need to determine the best methods for selecting from the CUSUM signals those that might be important for public health. Evaluations of medication surveillance document a wide range of conclusions on the usefulness of the data, depending on such factors as study population characteristics, type of medication, and disease outcome. For example, a year-long comparison of prescriptions for antidepressants and anxiolytics with matched outpatient records from a military health-care system serving 4.5 million persons reported a sensitivity of 0.76 and a specificity of 0.94 for the prescription data's performance as an indicator of diagnosed disorders (5); these measures are much higher than those reported here (sensitivity = 0.5; specificity = 0.32). However, a study of OTC medications among a large population (in six urban areas in three states) reported a high correlation between OTC electrolyte sales and hospitalization of children aged <5 years with various respiratory and diarrheal diseases (4). In comparison, use of sales volumes of OTC cough, cold, and antidiarrheal medications in spatial analyses in New York City has produced an average of two spatial signals per month for each syndrome, but none has led to early detection of a localized outbreak (3). Among the possible alternatives to relying only on the daily CUSUM analyses, the following are being evaluated: aggregating county-level counts by week for comparison with other, more traditional surveillance methods (e.g., weekly Medicaid prescriptions for influenza agents versus weekly reports from sentinel physicians of percent of patients seen with influenza-like illness); use of the spatiotemporal scan statistic at the ZIP code level to determine if clusters of elevated Medicaid prescriptions are linked to disease occurrence (e.g., Medicaid prescriptions for electrolyte mixtures indicate an increase in incidence of reported shigellosis cases in children); and correlation of statewide Medicaid prescriptions with the timing of seasonal increases in infectious disease (e.g., the increase in Medicaid prescriptions for influenza agents and the increase in laboratory-confirmed influenza across the state). Development of any analytic methods that identify prescription increases linked to actual disease activity on the basis of these studies will have to be evaluated for their usefulness to public health surveillance. Examples of useful early or real-time detection of disease include indications of an upsurge in influenza-like illness in counties without reporting sentinel physicians; detection of a clustering of increased prescriptions in ZIP codes in adjacent counties when an increase in disease is not noticeable at the county level; and confirmation of the absence of unusual prescription activity when the possibility of a biologic terrorism threat is being investigated. ConclusionMedicaid prescription data are routinely collected and can be readily available for syndromic surveillance. This data source has potential value as an indicator of disease activity. Certain features of this outbreak were conducive to its detection through Medicaid prescription data. First, the majority of cases and a substantial proportion of contacts receiving prophylaxis were enrolled in Medicaid. Second, the number of potential contacts was quite large, given the institutional setting of the outbreak, resulting in many prophylactic treatments that generated a CUSUM signal. Finally, pertussis treatment and prophylaxis are usually done with macrolide antibiotics, although this class of drug also has other uses. References
Table 1  Return to top. Figure 1  Return to top. Table 2  Return to top. Figure 2  Return to top.
Disclaimer All MMWR HTML versions of articles are electronic conversions from ASCII text into HTML. This conversion may have resulted in character translation or format errors in the HTML version. Users should not rely on this HTML document, but are referred to the electronic PDF version and/or the original MMWR paper copy for the official text, figures, and tables. An original paper copy of this issue can be obtained from the Superintendent of Documents, U.S. Government Printing Office (GPO), Washington, DC 20402-9371; telephone: (202) 512-1800. Contact GPO for current prices. **Questions or messages regarding errors in formatting should be addressed to mmwrq@cdc.gov.Date last reviewed: 8/5/2005 |
|||||||||
|