 |
|
|
|
|
|
|
| ||||||||||
|
|
|
|
|
|
|
||||
| ||||||||||
|
|
|
|
|
Persons using assistive technology might not be able to fully access information in this file. For assistance, please send e-mail to: mmwrq@cdc.gov. Type 508 Accommodation and the title of the report in the subject line of e-mail. National Retail Data Monitor for Public Health SurveillanceMichael M. Wagner,1 F-C.
Tsui,1 J. Espino,1 W. Hogan,1 J. Hutman,1 J. Hersh,2 D. Neill,3 A. Moore,1,3 G. Parks,1 C. Lewis,4 R. Aller5
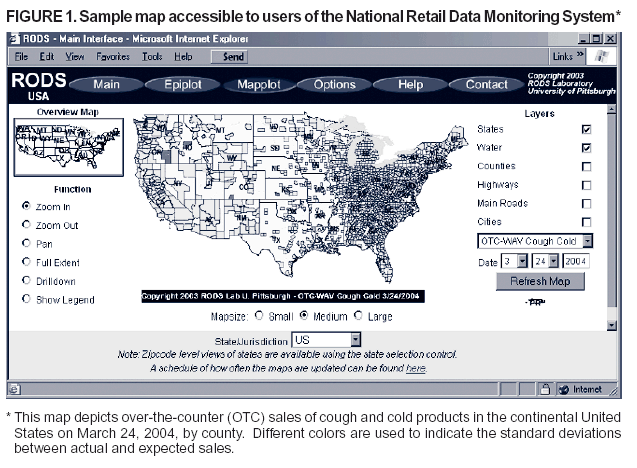
Corresponding author: Michael M. Wagner, Real-Time Outbreak and Disease Surveillance Laboratory, University of Pittsburgh, Suite 500, Cellomics Building, 500 Technology Drive, Pittsburgh, PA 15219. Telephone: 412-383-8137; Fax: 412-383-8135; E-mail: mmw@cbmi.pitt.edu. AbstractThe National Retail Data Monitor (NRDM) is a public health surveillance tool that collects and analyzes daily sales data for over-the-counter (OTC) health-care products. NRDM collects sales data for selected OTC health-care products in near real time from >15,000 retail stores and makes them available to public health officials. NRDM is one of the first examples of a national data utility for public health surveillance that collects, redistributes, and analyzes daily sales-volume data of selected health-care products, thereby reducing the effort for both data providers and health departments. IntroductionThe National Retail Data Monitor (NRDM) is a public health surveillance tool that collects and analyzes daily sales data for over-the-counter (OTC) health-care products from >15,000 retail stores nationwide. NRDM makes aggregated and analyzed data available to public health officials free of charge (1). A key rationale for building NRDM is that persons with infectious diseases often purchase OTC health-care products early in the course of their illnesses (2,3). Furthermore, retrospective studies of certain outbreaks have indicated that monitoring OTC sales might have led to earlier detection (4--6). After decades of investment into developing Universal Product Codes (UPCs), optical check-out scanners, and analytic data warehouses, the retail industry has in effect constructed 95% of a surveillance-system pyramid onto which a capstone of data integration and analytic capability can be added to produce NRDM. NRDM's objectives are to 1) enlist participation of retailers to achieve 70% coverage of OTC sales nationally; 2) influence the industry toward real-time data collection; 3) obtain supplemental information needed for spatial analysis, adjustment for promotional effects, and maintenance of UPC analytic categories (e.g., liquid cough medications); 4) promote and develop this type of surveillance practice; 5) achieve fault and load tolerance; and 6) develop detection algorithms for the data. MethodsThe methods used to acquire and analyze retail data have been described in detail elsewhere (1). This paper summarizes and updates that information. Data AcquisitionData-sharing agreements between retailers and the University of Pittsburgh enable the university to collect daily sales counts by store and by UPC. Retailers transmit data to NRDM by secure file transfer protocol daily by 3:00 pm Eastern Time for the previous day's sales. NRDM aggregates the data by zip code and product category. Data AnalysisHealth departments receive either aggregated data or access to data-analysis tools via a secure Internet interface. The tools allow users to view sales of OTC health-care products on maps (Figure 1) and timelines. Various NRDM algorithms are under development, including 1) temporal and 2) spatio-temporal. The temporal algorithm involves univariate time-series analyses, one for each combination of category and zip code. Where uzct represents the unit sales of category c in zip code z on day t, the univariate detector learns a model from the set of sales before today {uzc1 uzc2 … uzc,t-2 uzc,t-1}. NRDM uses a specially tailored wavelet model (7) to predict units sold today. The advantages of wavelets are their ability to account for long-term trends (e.g., seasonal effects) and short-term properties (e.g., day-of-week effects). In its simplest form, the model predicts a Gaussian distribution for today's sales, with mean and variance learned from sales before today. The actual sales for today can be compared with this Gaussian distribution to produce a z-score (i.e., the number of standard deviations by which today's sales lie above the mean). The z-score can be converted to a p-value to signal alerts. The spatio-temporal algorithm runs a specially tailored spatial scan statistic (8) over all regions. Each region is evaluated according to the likelihood ratio of the data under the assumption of an increased product demand in the region versus no such increase. Because the data are on a national level, computational tractability is a major concern for such a use of the scan statistic. A fast multiresolution method is used (9). Fault and Load ToleranceA key requirement for NRDM is fault and load tolerance. NRDM is fault-tolerant, with the exception of the server site and Internet connection, which are single and therefore subject to loss of connection. These vulnerabilities will be addressed by creation of a second site and second Internet connection. Load tolerance refers to NRDM's ability to handle simultaneous access by a substantial number of users. Preliminary load-tolerance tests using Apache JMeter (10) have identified certain bottlenecks, which have since been rectified. Complete load testing is planned to determine the maximum number of simultaneous users NRDM can accommodate. Project AdministrationNRDM requires substantial administrative work, including managing contacts with retailers, executing data-sharing agreements, coordinating meetings, handling press inquiries, developing fact sheets, and raising and dispensing funds. This work is handled jointly by volunteers from state and local health departments, staff of the Real-Time Outbreak and Disease Surveillance Laboratory, and a University of Pittsburgh associate general counsel. Initially NRDM was organized as a university-based, grant-funded project. In May 2003, representatives from four state health departments (Pennsylvania, New York, Ohio, and Georgia) founded an informal association to provide leadership and guidance that holds monthly conference calls; the association is open to any health department. ResultsNRDM has operated continuously since December 2002. The project uses explicit measures of progress and reports them monthly to the working group, including
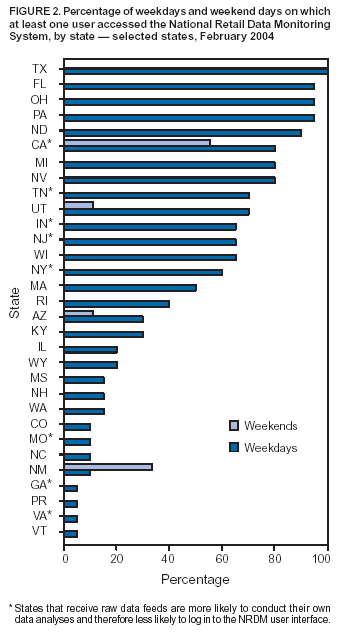
As of March 2004, progress towards the goal of 70% data coverage (a level achievable using data from national chains) has reached approximately 40% of total national sales. The time latency is 1 day for all retailers (with one exception that provides a feed every 2 hours). The project has created >400 user accounts for health department employees in 44 states and Puerto Rico. Ten entities receive aggregate data feeds from the system. Progress towards integration of NRDM into public health practice is measured by the number of system logins. Analyses are conducted to track daily and monthly usage and to compare weekday and weekend logins (Figure 2). A level of 100% usage means that at least one user in the state logged in each day. Weekend checking remains low but might increase as public health departments recognize the need to evaluate surveillance data as it becomes available, 7 days/week. Prospective evaluation of NRDM as a public health surveillance tool is underway. For example, NRDM has demonstrated the marked effect of influenza on sales of pediatric cough and cold remedies and pediatric antipyretics, or the effect of fires in southern California on sales of bronchial remedies. (Authorized public health users can access case studies of these and other outbreaks by using the NRDM Internet interface. To obtain access, please send e-mail to nrdmaccounts@cbmi.pitt.edu). Future PlansFrom an early warning perspective, the single most important improvement to NRDM will be a reduction in reporting latency after the time of purchase. Better detection performance might also be achieved through improved algorithms, which are under development. Because they share geographic borders, the United States and neighboring countries need interoperable public health surveillance capability. Retail data monitoring is feasible in Canada, Mexico, and other countries where retailers use the UPC system or the European Article Numbering system, with which it is interconvertible. A permanent organizational home for NRDM is also being explored, with an estimated annual operating cost of approximately $1 million. ConclusionsNRDM is a data utility that collects, redistributes, and analyzes daily sales-volume data of selected health-care products. A national-level, data-utility approach reduces the effort required for health departments to monitor sales of OTC health-care products. Health departments can instead concentrate on analysis of data and investigation of anomalies. Acknowledgments Grant support for NRDM is provided by Pennsylvania Department of Health Bioinformatics Grant ME-01 737; Alfred P. Sloan Foundation; Passaic Water Commission; and the New York State, Washington, Ohio, and Utah departments of health. Participating corporations include ACNielsen, Information Resources, Inc., National Association of Chain Drug Stores, and Global Strategic Solutions. References
Figure 1  Return to top. Figure 2  Return to top.
Disclaimer All MMWR HTML versions of articles are electronic conversions from ASCII text into HTML. This conversion may have resulted in character translation or format errors in the HTML version. Users should not rely on this HTML document, but are referred to the electronic PDF version and/or the original MMWR paper copy for the official text, figures, and tables. An original paper copy of this issue can be obtained from the Superintendent of Documents, U.S. Government Printing Office (GPO), Washington, DC 20402-9371; telephone: (202) 512-1800. Contact GPO for current prices. **Questions or messages regarding errors in formatting should be addressed to mmwrq@cdc.gov.Page converted: 9/14/2004 |
|||||||||
This page last reviewed 9/14/2004
|