 |
|
|
|
|
|
|
| ||||||||||
|
|
|
|
|
|
|
||||
| ||||||||||
|
|
|
|
|
Persons using assistive technology might not be able to fully access information in this file. For assistance, please send e-mail to: mmwrq@cdc.gov. Type 508 Accommodation and the title of the report in the subject line of e-mail. Dual-Model Approach to Syndromic Surveillance Using Hospital Emergency Department DataKaren Green,1 B. Miller,1 M. Hadidi,1 M. Zimmerman,2 R. Danila1
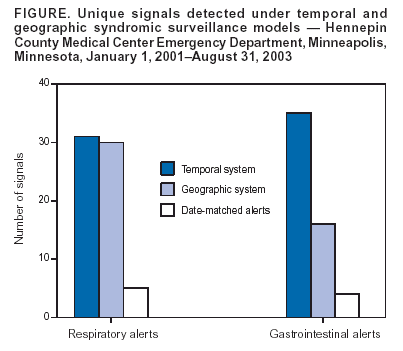
Corresponding author: Karen Green, 717 Delaware Street SE, Minneapolis, MN 55414. Telephone: 612-676-5414; Fax: 612-676-5743; E-mail: karen.1.green@health.state.mn.us. AbstractIntroduction: The initial symptoms of diseases resulting from biologic terrorism are likely to appear as respiratory illness (RI) or gastrointestinal illness (GI). Increased counts of RI- or GI-related International Classification of Diseases, Ninth Revision (ICD-9) codes in a syndromic surveillance system might indicate an outbreak. Only a limited number of syndromic surveillance systems analyze data for temporal and geographic disease clustering simultaneously. Objectives: A comprehensive syndromic surveillance system was created through analysis of emergency department (ED) data by using both time-series (TSS) and geographically based syndromic surveillance (GSS) models. Methods: Minnesota Department of Health receives patient-encounter data from the Hennepin County Medical Center (HCMC) ED via secure file transfer protocol (FTP) file daily. TSS uses a regression model adjusted for day-of-week and seasonal effects. Autocorrelation and cumulative sum analysis of predictive residuals detects unexpected increases of ICD-9 counts. The GSS model is an adapted mixed models approach. Daily counts are compared with historic data by using the binomial probability mass function. Analyses were performed for HCMC ED patients reporting during January 2001--August 2003 (32 months). The ED treats approximately 100,000 patients annually. Results: RI counts exceeded threshold 31 times under TSS and 30 times under GSS, matching on five dates (9%). GI counts exceeded threshold 35 times under TSS and 16 times under GSS, matching on four dates (9%) (Figure). Conclusions: Unmatched dates resulted from the differing statistical approaches of each model. Signals detected under TSS indicate temporal clustering; signals detected under GSS indicate spatial clustering. These combined analyses allow observation of disease patterns by examining concurrent temporal and geographic effects. A signal detected by using TSS or GSS can initiate further examination of encounter data, including chart reviews by medical facility staff. Concurrent signals detected from both TSS and GSS warrant rapid follow-up. Figure  Return to top.
Disclaimer All MMWR HTML versions of articles are electronic conversions from ASCII text into HTML. This conversion may have resulted in character translation or format errors in the HTML version. Users should not rely on this HTML document, but are referred to the electronic PDF version and/or the original MMWR paper copy for the official text, figures, and tables. An original paper copy of this issue can be obtained from the Superintendent of Documents, U.S. Government Printing Office (GPO), Washington, DC 20402-9371; telephone: (202) 512-1800. Contact GPO for current prices. **Questions or messages regarding errors in formatting should be addressed to mmwrq@cdc.gov.Page converted: 9/14/2004 |
|||||||||
This page last reviewed 9/14/2004
|