 |
|
|
|
|
|
|
| ||||||||||
|
|
|
|
|
|
|
||||
| ||||||||||
|
|
|
|
|
Persons using assistive technology might not be able to fully access information in this file. For assistance, please send e-mail to: mmwrq@cdc.gov. Type 508 Accommodation and the title of the report in the subject line of e-mail. New Twist on Old Methods --- Simple Schemas for Disease and Nonbattle Injury Surveillance in Deployment SettingsJ. Kevin Grayson, P. Gould
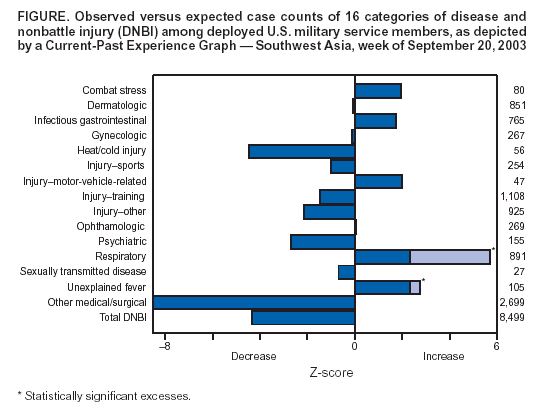
Corresponding author: Kevin Grayson, 60 MDSS/SGSE, 101 Bodin Circle, Travis AFB, CA 94535. E-mail: kevin.grayson@travis.af.mil. AbstractIntroduction: Medics deployed with U.S. troops routinely collect disease and nonbattle injury (DNBI) data to provide early outbreak detection and identify adverse trends. Robust statistics are available to analyze surveillance data; however, these methods often require extensive historic data, are computationally difficult, and can be confusing to inexperienced users. Methods: A modified current-past experience graph (CPEG) and statistical process control charts (SPCCs) were developed to track DNBI trends among deployed service members. The CPEG method compares weekly counts for 16 DNBI categories with expected values from the previous 4 weeks by using the Poisson function normal approximation. These are transformed to z-scores and charted with color codes to indicate when a value exceeds threshold limits, corresponding to the 99th percentile. The u-bar method (i.e., a statistical process control method that also relies on Poisson approximation) is used to produce SPCC, comparing observed rates with the average from the previous 20 weeks for each DNBI category. Although the necessary calculations could be performed by hand, spreadsheet templates were produced for field use. Stata® statistical software is used routinely to automate the process and provide graphs to customers over the Internet. Results: These charts have been used to monitor DNBI reports from Operation Enduring Freedom and Operation Iraqi Freedom since their inception. A typical CPEG chart shows significant increases in the respiratory and unexplained fever categories (Figure). The CPEG and SPCC methods are complementary. CPEG summarizes all data on a single chart and is highly sensitive. SPCC provides more detail and underscores long-term trends. Conclusions: Customers find CPEG and SPCC useful because they summarize a substantial amount of information and are readily understood by nonmedical commanders. Figure  Return to top.
Disclaimer All MMWR HTML versions of articles are electronic conversions from ASCII text into HTML. This conversion may have resulted in character translation or format errors in the HTML version. Users should not rely on this HTML document, but are referred to the electronic PDF version and/or the original MMWR paper copy for the official text, figures, and tables. An original paper copy of this issue can be obtained from the Superintendent of Documents, U.S. Government Printing Office (GPO), Washington, DC 20402-9371; telephone: (202) 512-1800. Contact GPO for current prices. **Questions or messages regarding errors in formatting should be addressed to mmwrq@cdc.gov.Page converted: 9/14/2004 |
|||||||||
This page last reviewed 9/14/2004
|