At a glance
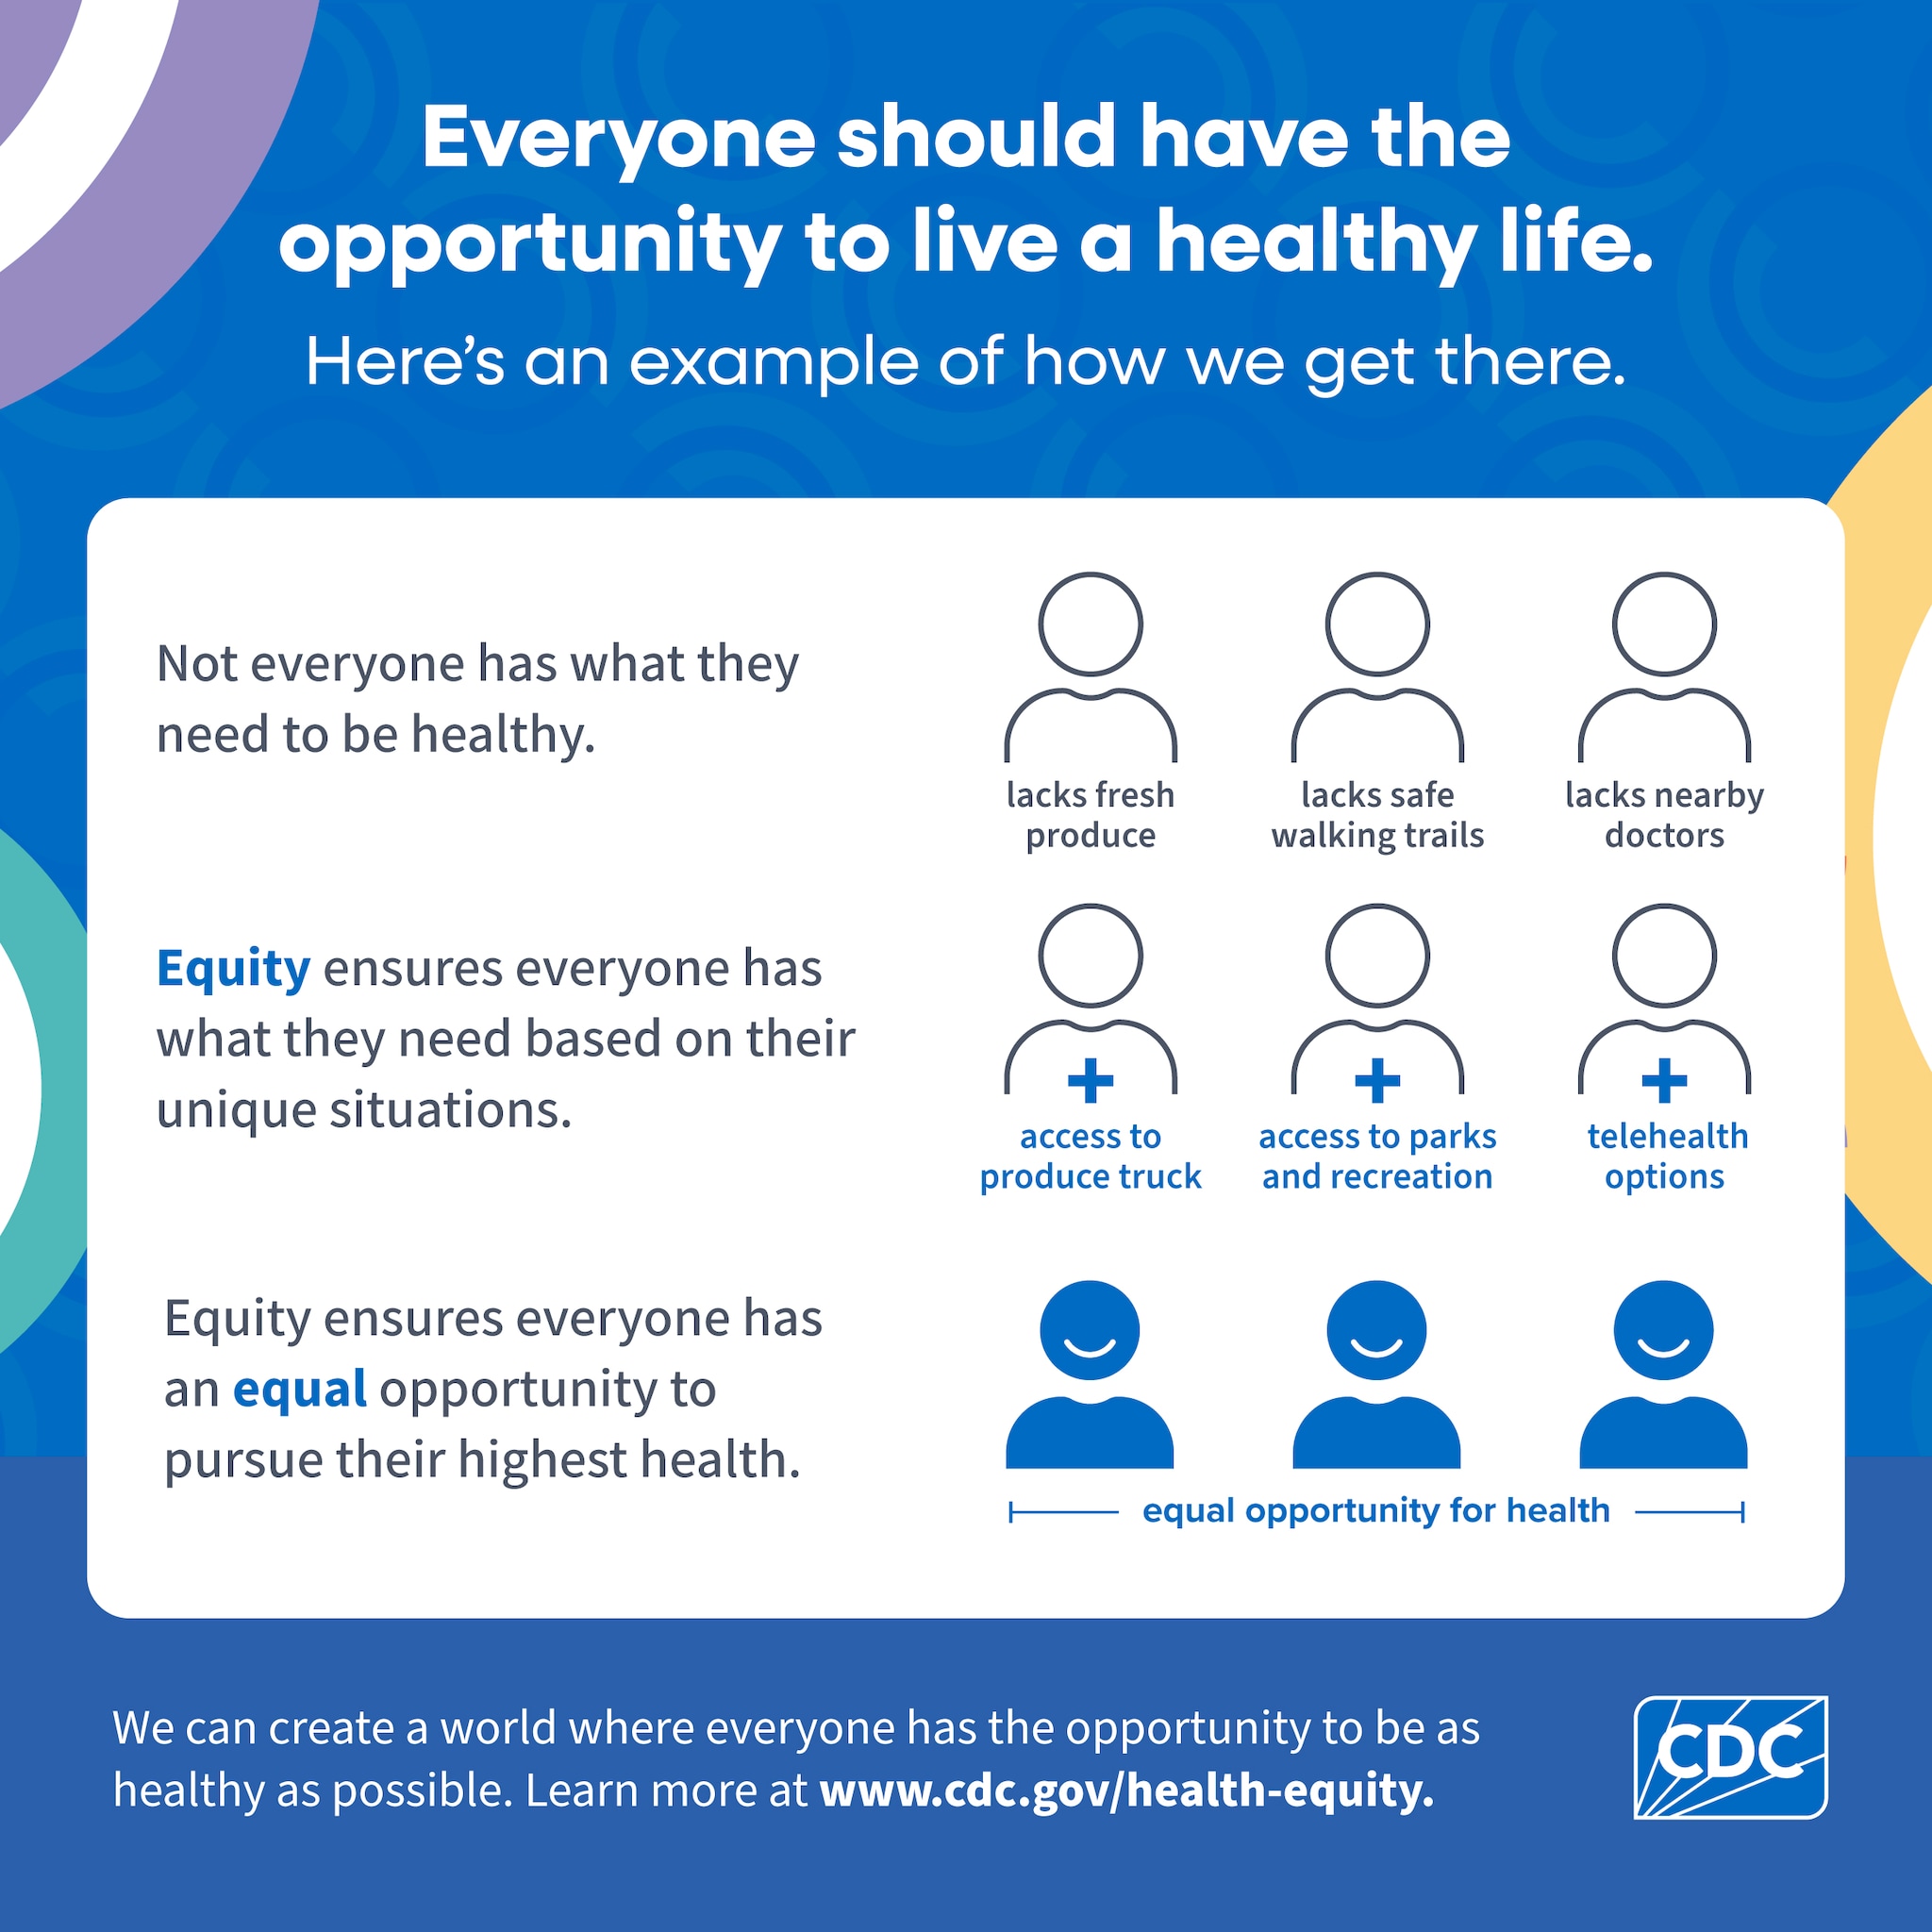
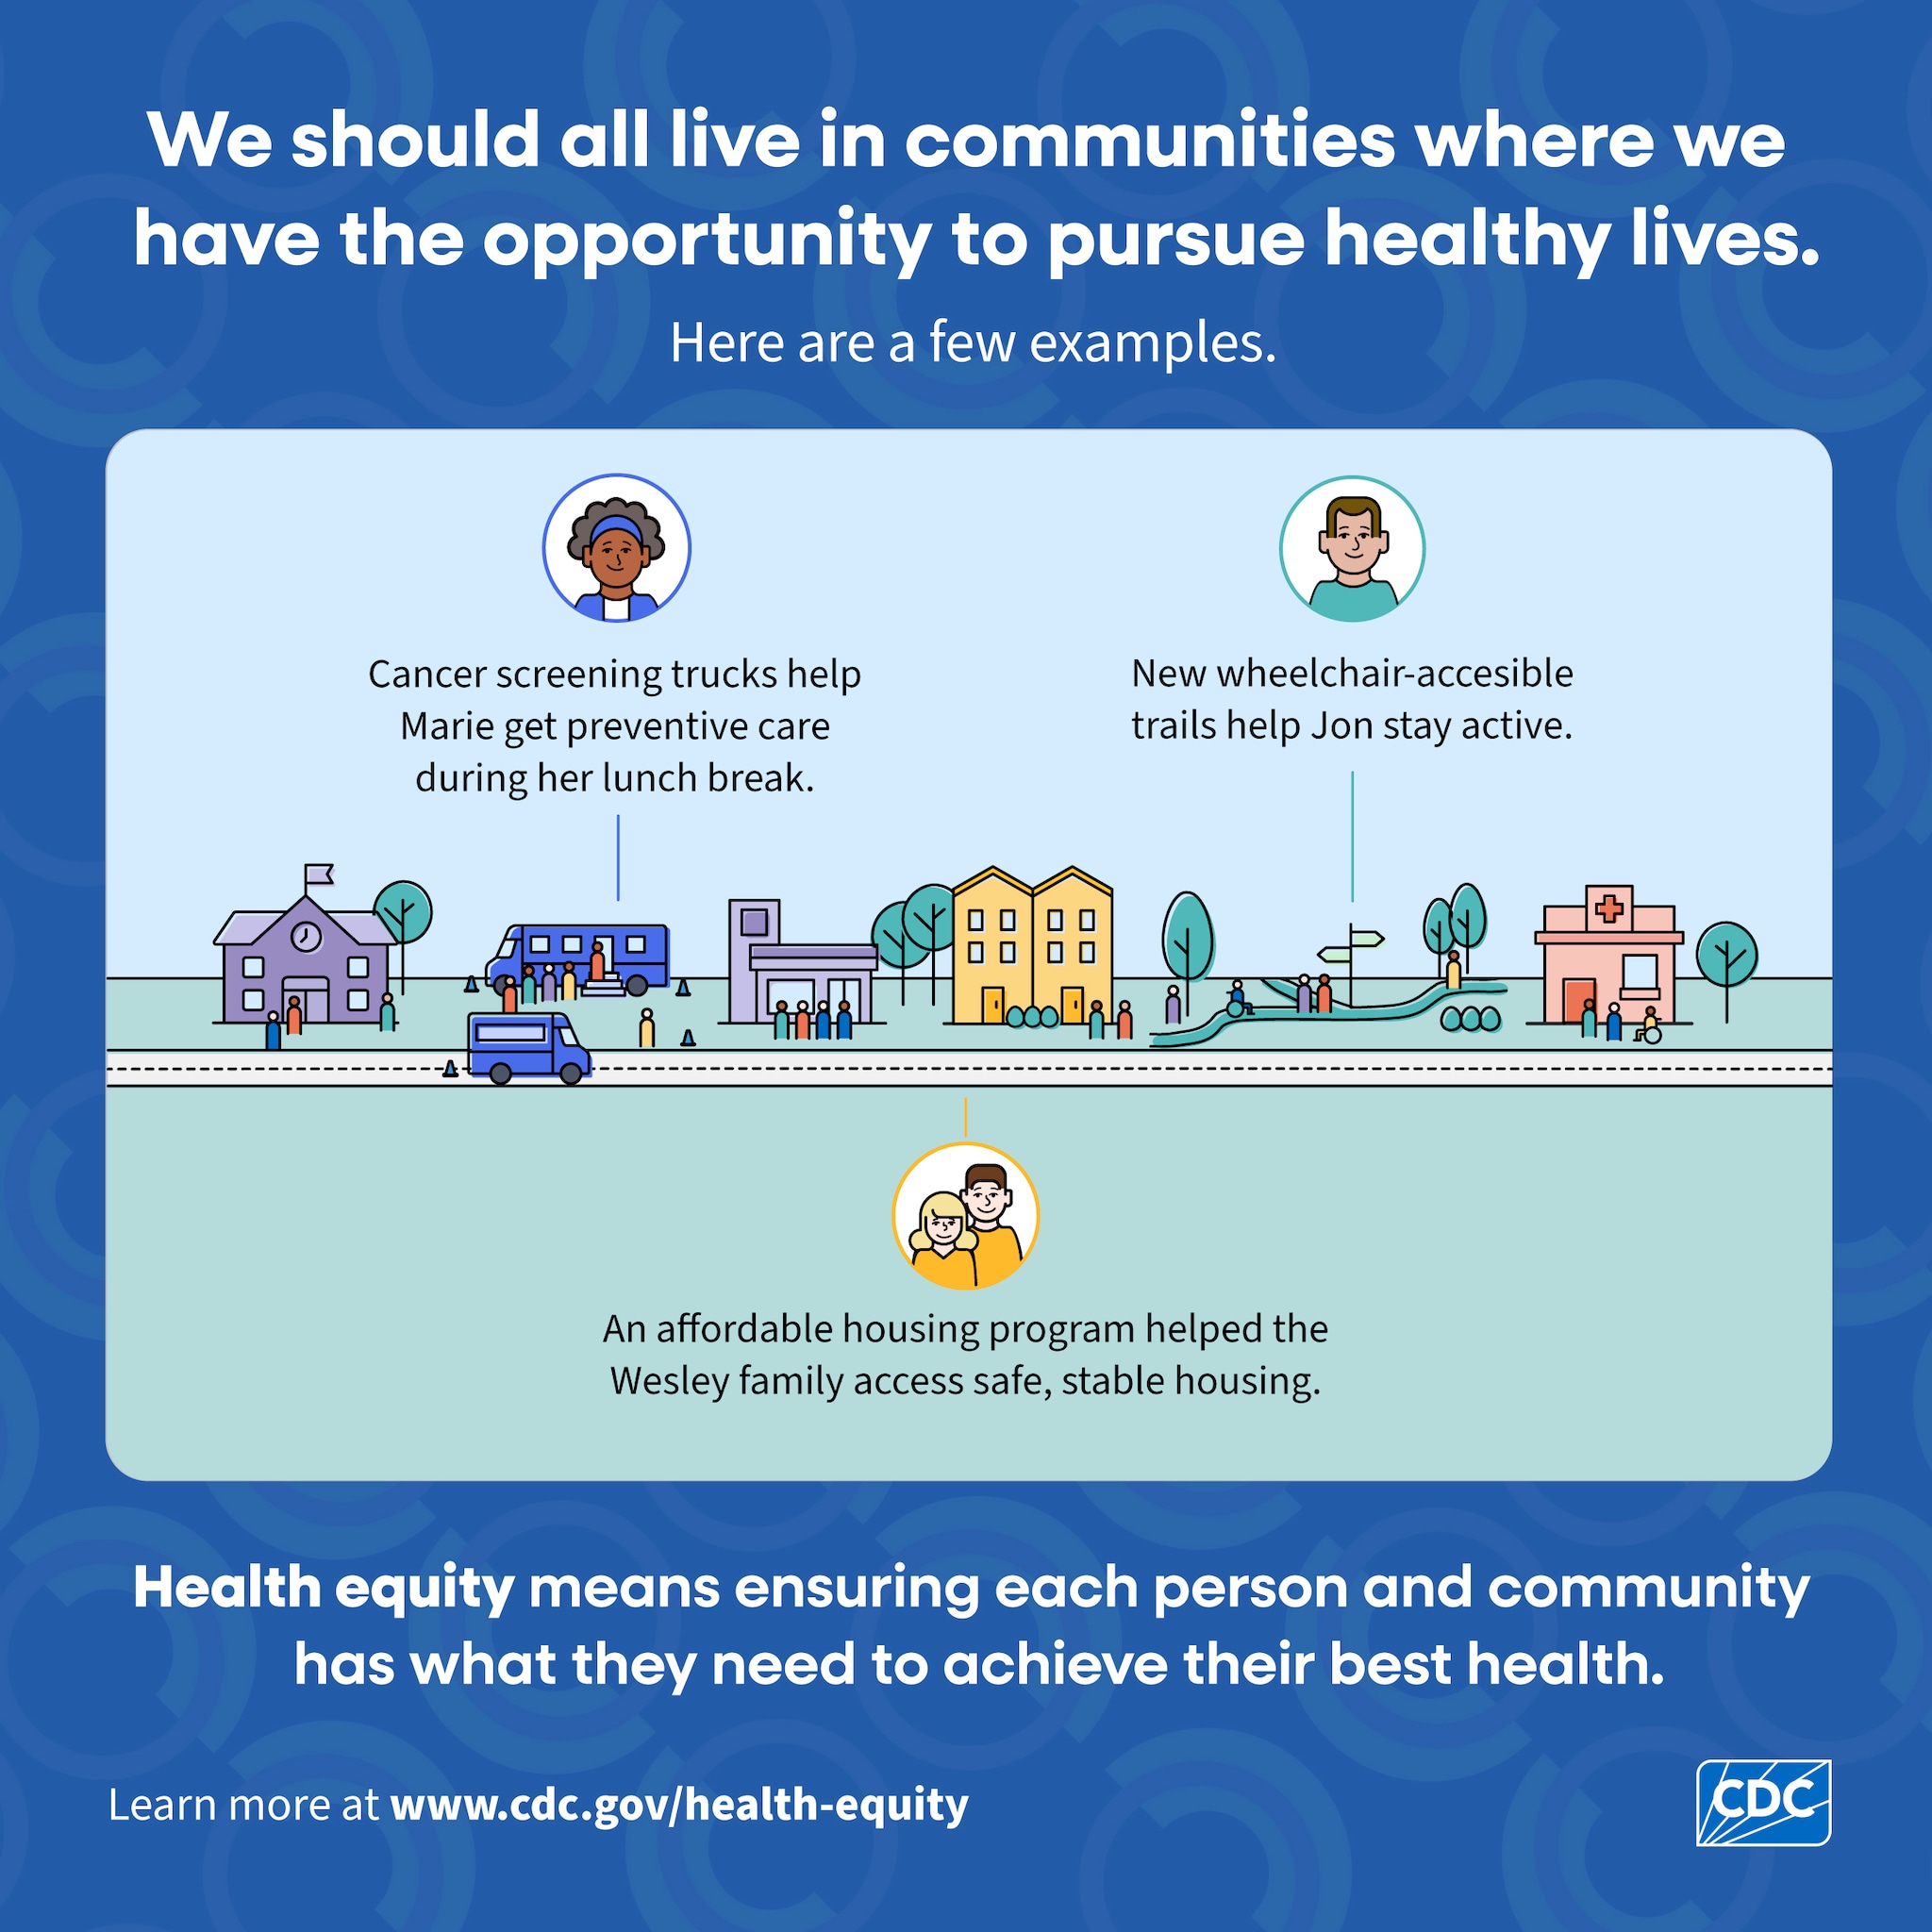
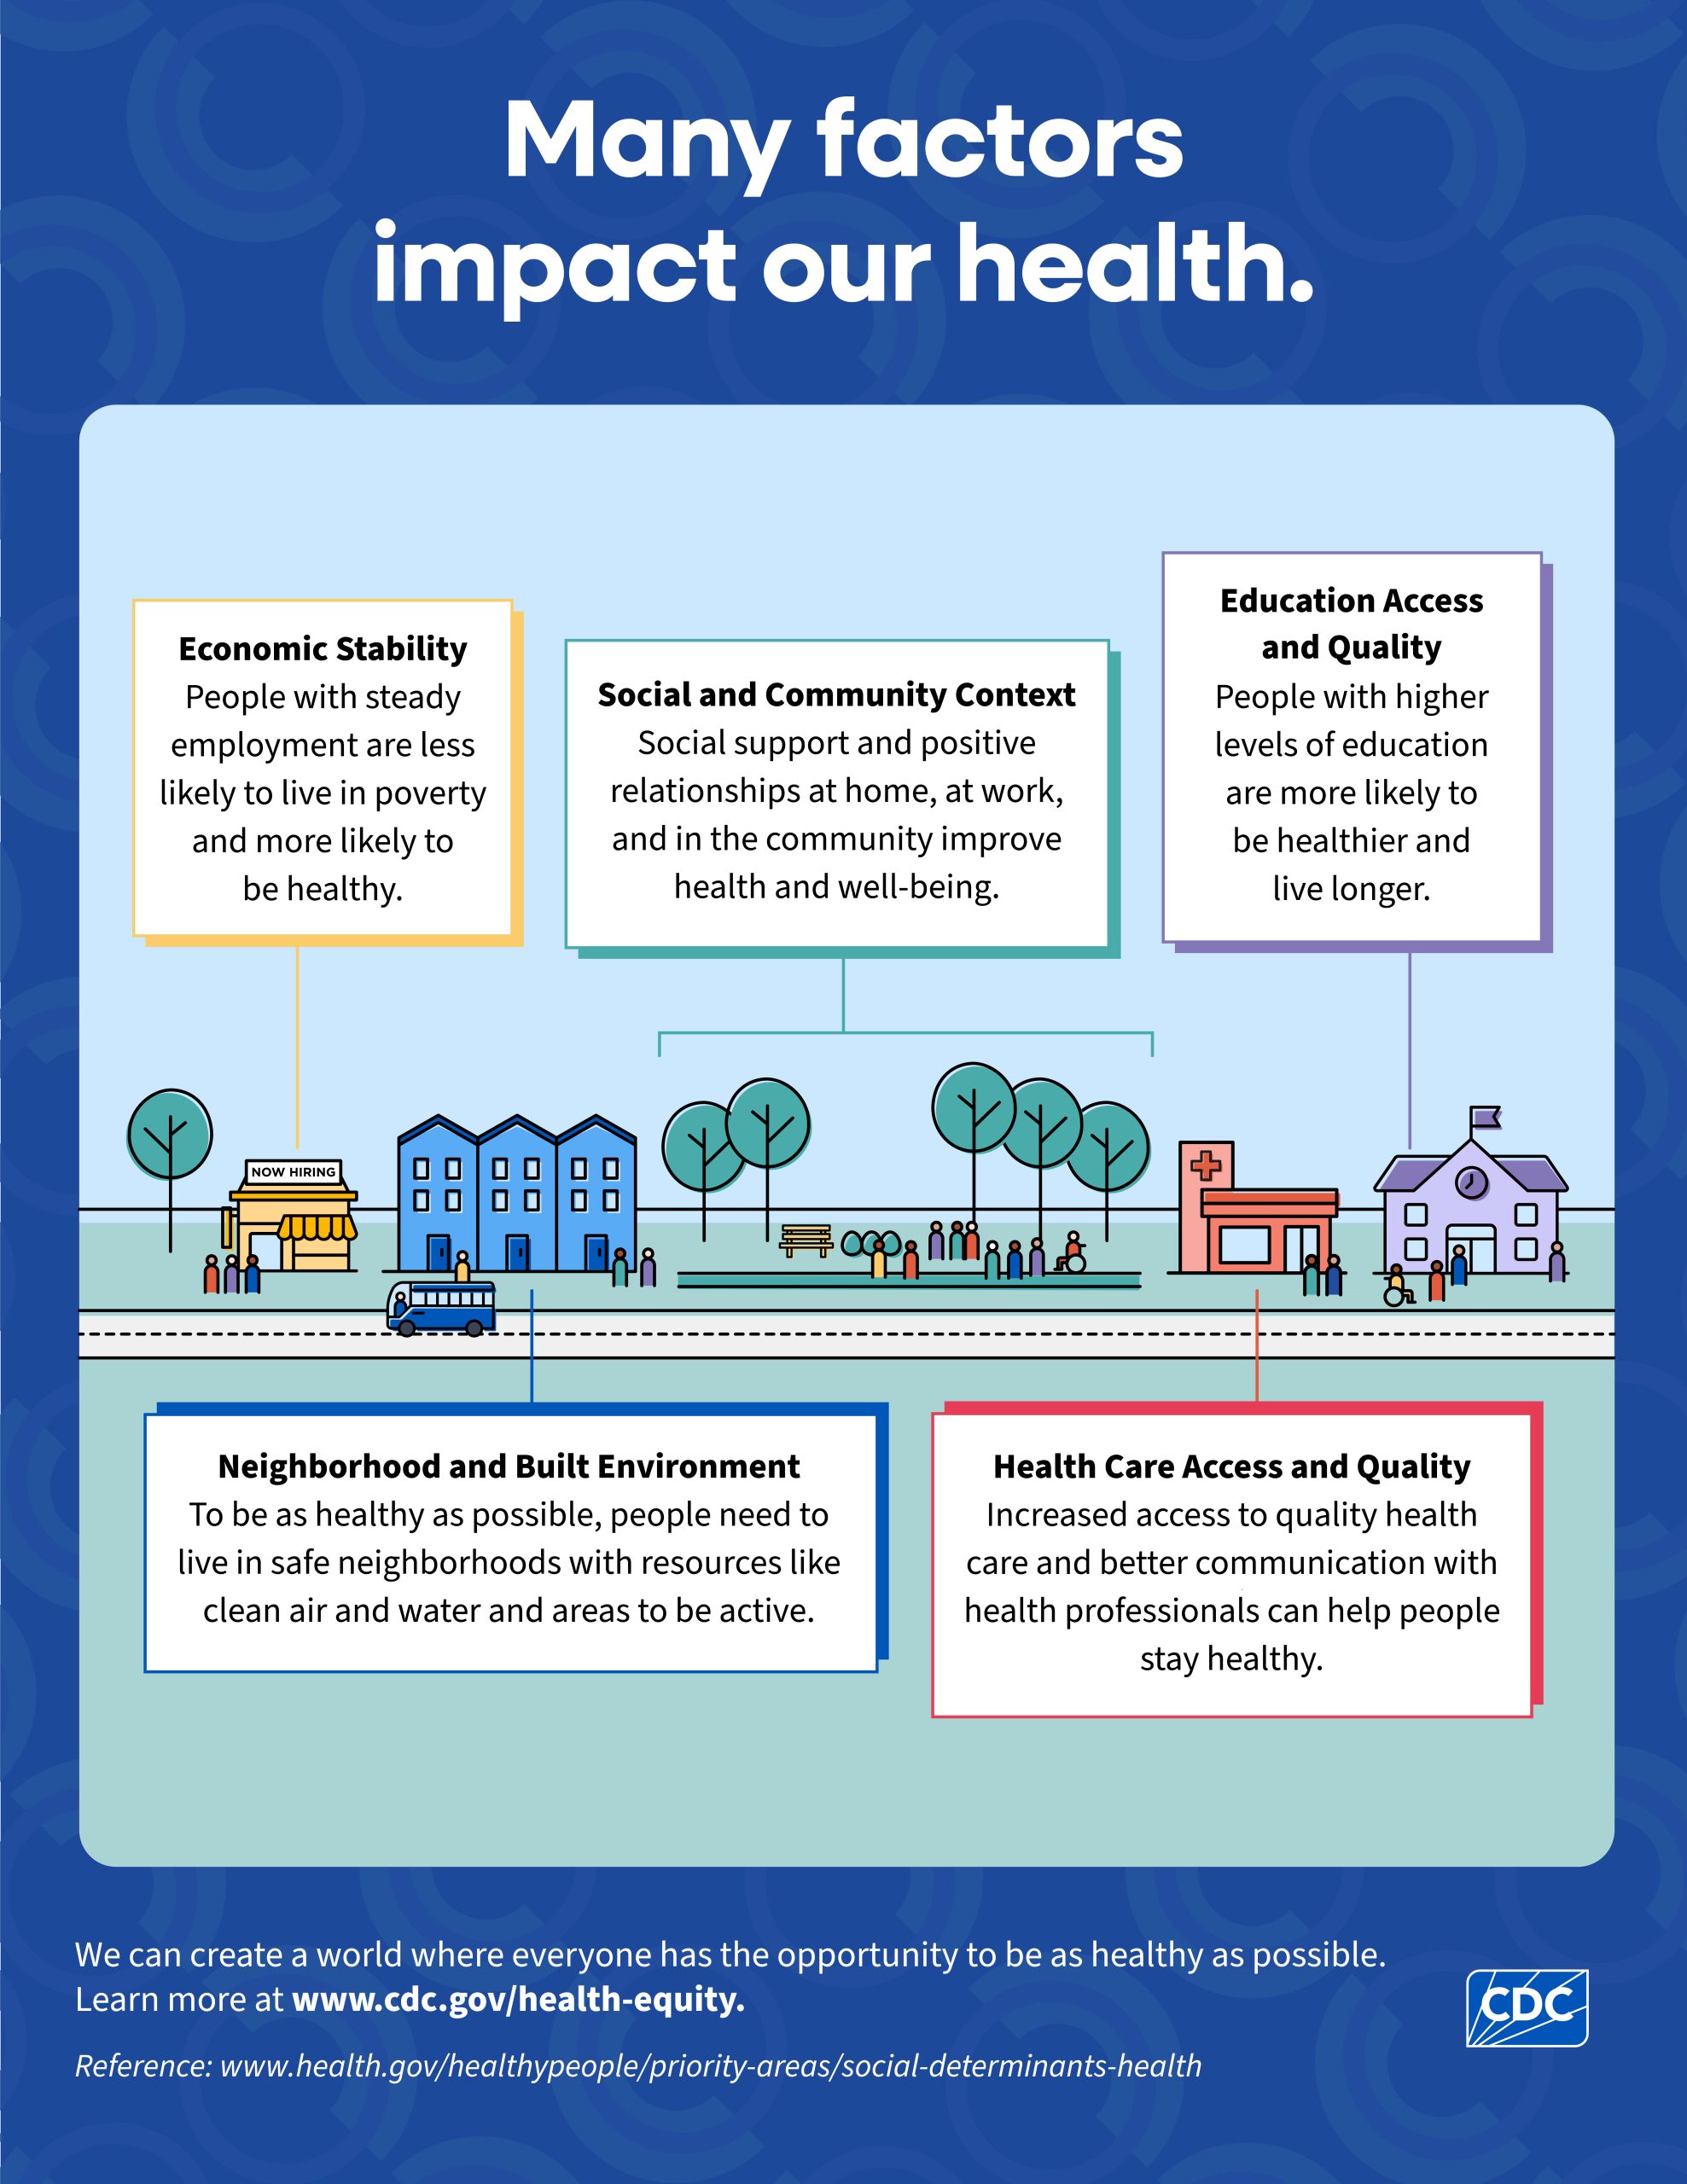
CDC's Office of Health Equity developed infographics to help explain the concepts of health equity, equity vs. equality and social determinants of health.
Infographics
These infographics help explain health equity, social determinants of health, and the difference between equity and equality.


Purpose
Recognizing the need for enhanced strategies, tools, and resources to support effective communication about health equity, CDC's Office of Health Equity developed infographics to help explain the health equity concepts. The infographics are downloadable and we invite you to share them with others.
The process for creating these new infographics included:
- Conducting a landscape assessment of existing health equity messaging research and previously developed infographics;
- Developing new infographics that applied best practices gleaned from the landscape assessment and findings from previous OHE message testing;
- Conducting qualitative and quantitative message testing with general audiences and public health professionals to assess the effectiveness and appropriateness of the newly developed images and messaging; and
- Applying findings from testing to develop the final suite of infographics.
