What to know
BMI-for-age can be plotted on growth charts. Percentile curves on the growth charts indicate the BMI-for-age percentile. This is the relative position of a child’s BMI to children of the same sex and age from the reference population used to create the growth charts.

Child and adolescent BMI categories
In children and adolescents 2 to 20 years old, BMI categories are based on BMI-for-age percentiles and defined as:
BMI Category
BMI Range
Underweight
Less than the 5th percentile
Healthy Weight
5th percentile to less than the 85th percentile
Overweight
85th percentile to less than the 95th percentile
Obesity
95th percentile or greater
Severe Obesity
120% of the 95th percentile or greater, or 35 kg/m2 or greater
Use the following case examples to practice plotting and interpreting BMI.
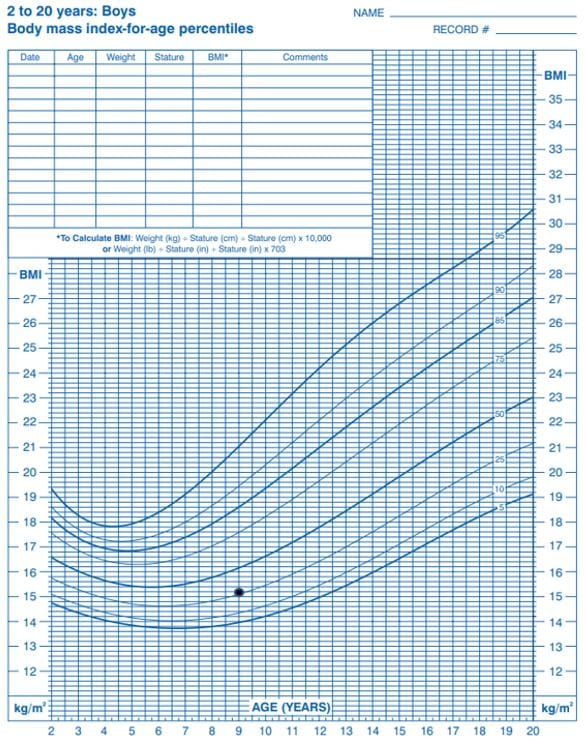
Case example 1: BMI-for-age
Name: Sam
Age: 9 years
Sex: boy
Height: 105.4 cm
Weight: 16.9 kg
Calculate BMI metrics
By-Hand Calculation: (16.9 kg / 105.4 cm / 105.4 cm) x 10,000 = 15.2
BMI: 15.2
BMI-for-age Percentile: 28th
Sam's doctor can use CDC's Child and Teen BMI Calculator to generate BMI.
BMI-for-Age Growth Chart
Because Sam’s BMI is below the 97th percentile for his age and sex, Sam’s doctor can plot his BMI on CDC’s BMI-for-Age Growth Chart.

What does this mean?
Sam has a BMI of 15.2 kg/m2, placing him at the 28th percentile for age and sex. This means that Sam's BMI is greater than the BMIs of 28% of 9-year-old boys in the growth chart reference population.
Sam's BMI falls in the healthy weight category. The healthy weight category is defined as BMIs from the 5th percentile up to the 85th percentile for sex and age.
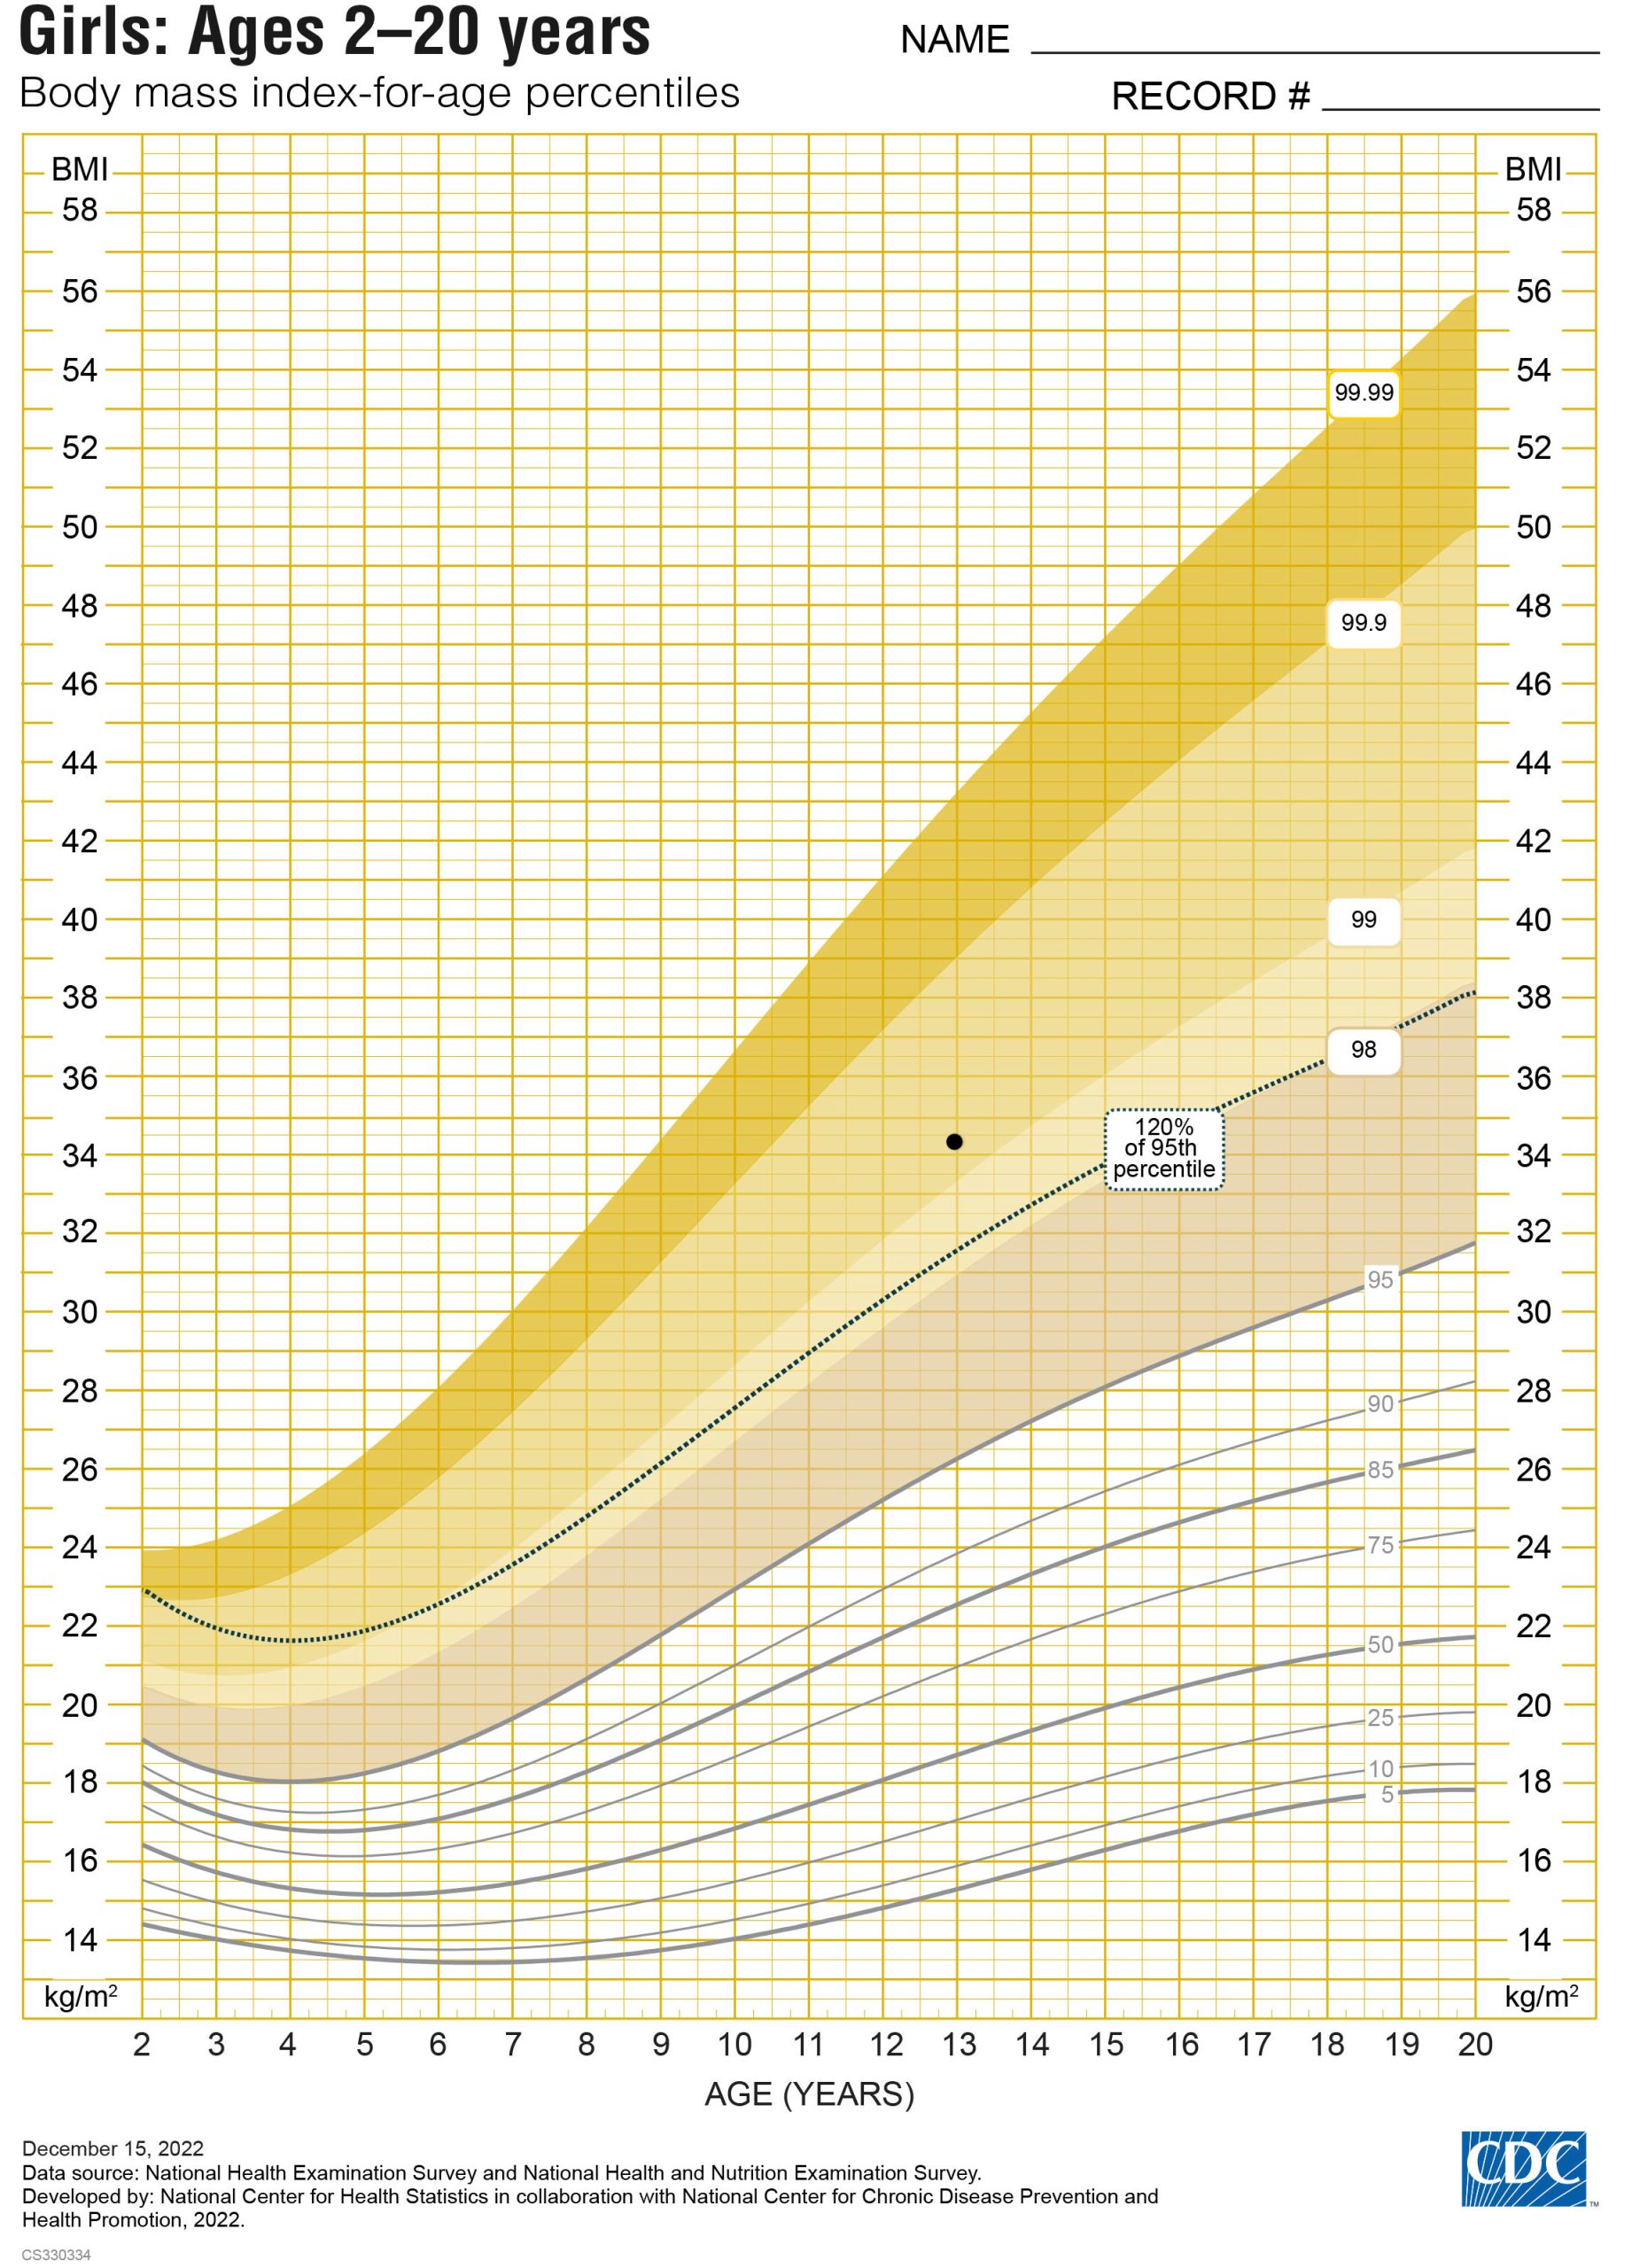
Case example 2: extended BMI-for-age
Name: Olivia
Age: 13 years
Sex: girl
Height: 60 inches
Weight: 175 pounds
Calculate BMI metrics
BMI: 34.2
Extended BMI-for-age Percentile: 99.2nd
Extended BMI-for-Age Growth Chart

What does this mean?
Olivia has a BMI of 34.2 kg/m2, placing her at the 99.2nd percentile for age and sex. This means Olivia's BMI is greater than the BMIs of 99.2% of 13-year-old girls in the growth chart reference population.
Olivia's BMI of 34.2 kg/m2 is 130% of the 95th percentile, which is in the severe obesity category. This means that Olivia's BMI is 1.3 times higher than the BMI that is the 95th percentile for 13-year-old girls. BMIs at or above 120% of the 95th percentile for sex and age, or BMIs that are 35.0 kg/m2 or above, are in the severe obesity category.
Calculate and Plot BMI
Test your knowledge
- Which of the following is NOT true?
- If a 7-year-old girl’s BMI is at the 75th percentile for sex and age, it means her BMI is greater than the BMIs of 75% of 7-year-old girls in the growth chart reference population.
- Sex, age, height, and weight are all required to calculate BMI-for-age percentiles in children and adolescents.
- In children and adolescents, severe obesity is defined as BMI at or above 120% of the 95th percentile for age and sex, or BMI at or above 35 kg/m2.
- Extended BMI-for-Age Growth Charts should be used to plot and track the BMIs for all children and adolescents.
- If a 7-year-old girl’s BMI is at the 75th percentile for sex and age, it means her BMI is greater than the BMIs of 75% of 7-year-old girls in the growth chart reference population.
See answers.A
- Answer: D. CDC’s Extended BMI-for-age growth charts should be used to plot and track BMIs for children and adolescents with very high BMIs (above the 97th percentile for age and sex). These extended charts can help with conversations about growth and care between providers, patients, and patients’ families.
