What to know
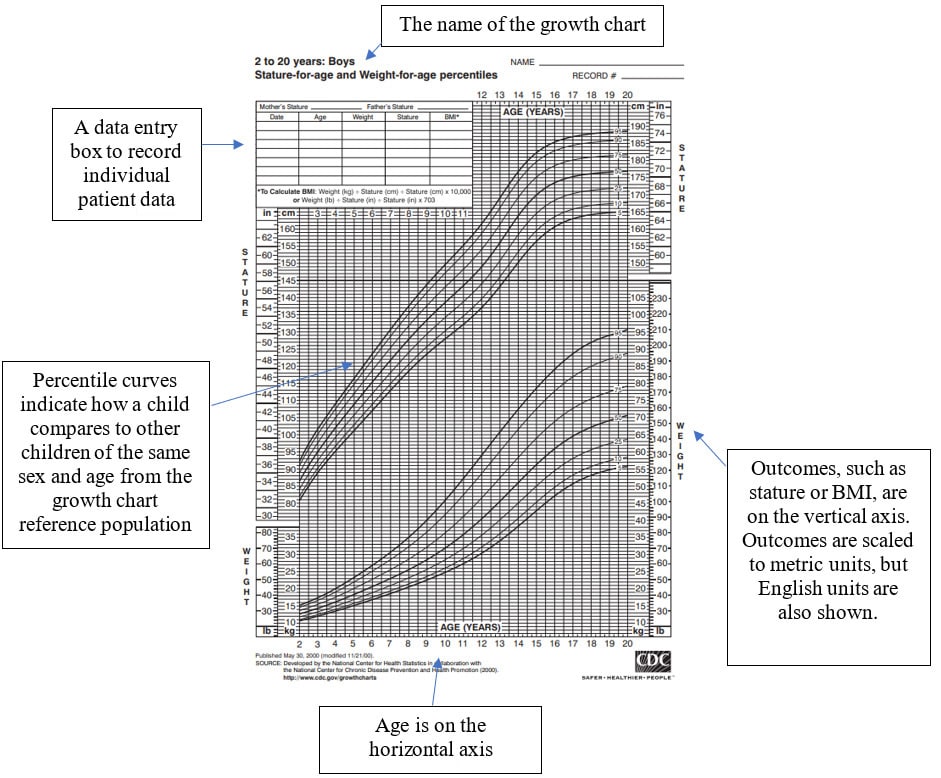
Clinical growth charts are percentile curves showing the distribution of selected body measurements in children and adolescents. Health care providers and parents commonly use growth charts to plot and track child and adolescent growth.

Growth chart features
Growth charts have several features, as shown in the example below.

What are percentiles?
An appropriate reference population, accurate measurements, and accurate age calculations are important factors when assessing childhood growth. Body measurements can be compared to the appropriate sex-specific growth chart. This allows pediatric health care providers to monitor growth and identify potential health or nutrition problems.
To view, print, or learn more, see Clinical Growth Charts.
CDC's Child and Teen BMI Calculator calculates BMI, BMI percentile, and BMI category for children and adolescents 2 to 20 years. It also plots BMI on the appropriate growth chart.
Test your knowledge
- The clinical growth charts display age on the horizontal x-axis and an outcome such as stature, weight, or BMI on the vertical y-axis.
- True
- False
- True
- The clinical growth charts display English units only.
- True
- False
- True
See answers.A
- Question 1: True. Question 2: False. The clinical growth charts are scaled to metric units (weight in kilograms and height in centimeters) but also display English units (weight in pounds and height in inches).
