At a glance
FoodNet Fast’s Population Survey Tool lets you see how often people in FoodNet’s surveillance area eat particular foods and have other exposures linked to diarrheal illness. It also lets you compare exposures for different groups of people.

Information about the data
The data include people's responses to questions about
- consumption of foods
- consumption of drinking water
- consumption of raw milk
- dietary practices
- food handling practices
- food safety behaviors
- contact with animals
- contact with recreational water
- recent travel history
- vomiting and diarrheal illness symptoms
- health-seeking behavior
You can see single or multiple exposures and can filter by sex, race, age group, geographic location, and season.
The data come from the most recent FoodNet Population Survey, which was conducted in 2018–2019 among 38,743 adults and children residing in FoodNet's surveillance area.
FoodNet collects these data to assess how often people
- have diarrheal illness
- have exposures associated with diarrheal illness
- seek health care for diarrheal illness
- eat various foods
The data can help
- Determine the burden of diarrheal illness in the United States
- In assessing whether a particular exposure might be the source of an outbreak
Using the Population Survey Tool
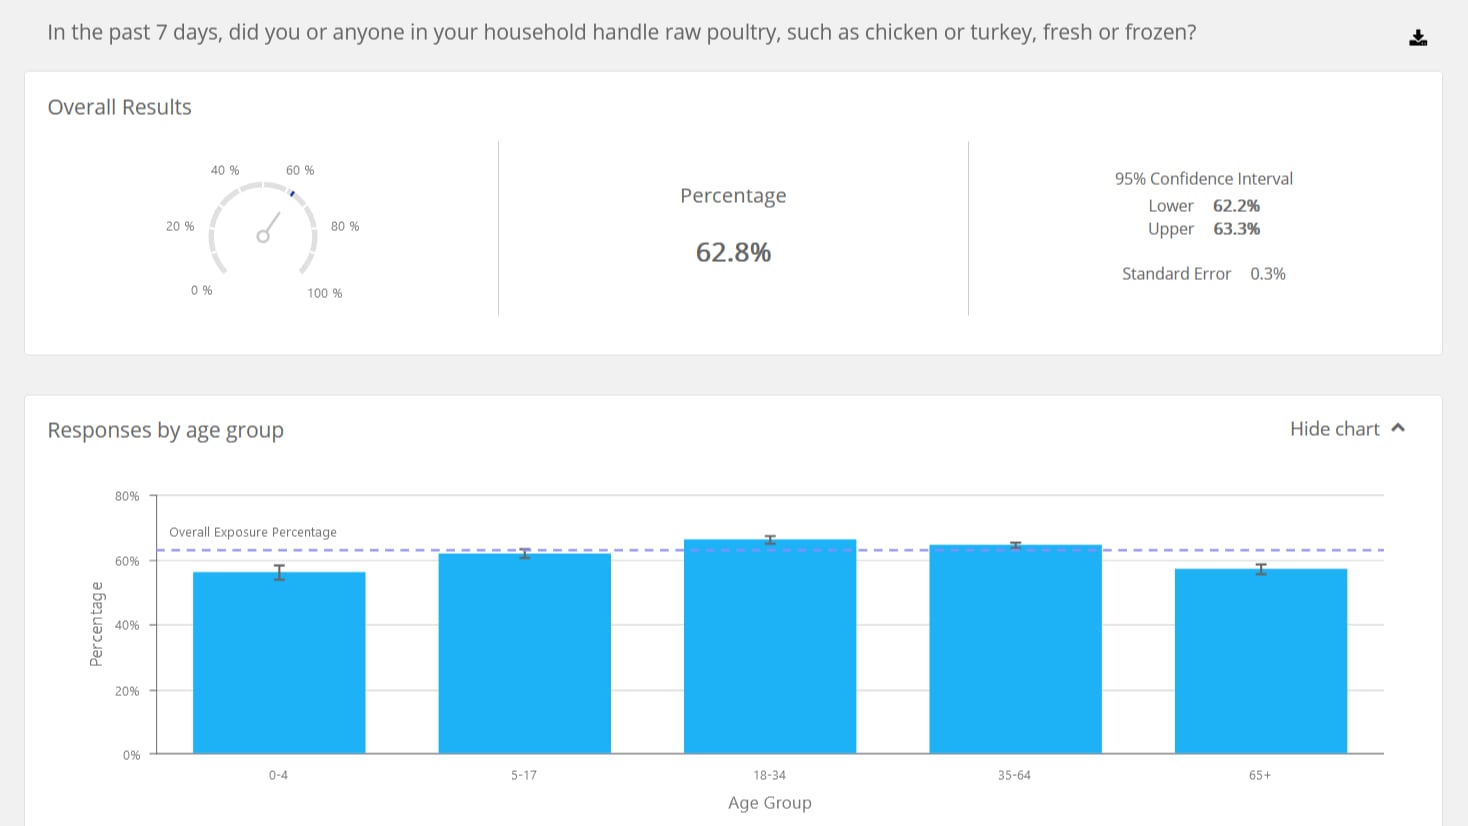
A confidence interval is a range of values that’s likely to include a certain value. A 95% confidence interval means the range will include the true value of that number 95% of the time.
The standard error of a mean approximates the standard deviation of a population mean based on a statistical sample of that population. It measures how much discrepancy is likely to be in the sample mean relative to the true population mean.
Resources
Start exploring FoodNet Fast now – or click the links below for more information.
