What to know
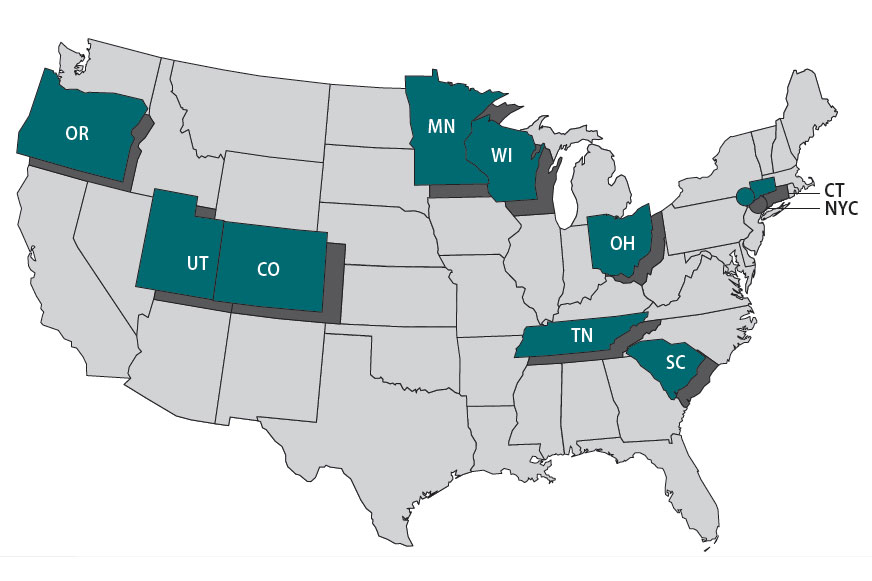
The Foodborne Diseases Centers for Outbreak Response Enhancement (FoodCORE) program addresses gaps in foodborne disease response through enhanced capacity in laboratory, epidemiology, and environmental health to improve timeliness and completeness of outbreak response activities. The FoodCORE centers during Year 13 (January 1, 2023–December 31, 2023) were Colorado, Connecticut, Minnesota, New York City, Ohio, Oregon, South Carolina, Tennessee, Utah, and Wisconsin.
Highlights
In 2023, the federal government ended the COVID-19 Public Health Emergency, but state and local health departments continued to experience obstacles. More people refused to be interviewed, and it took longer to reach them; people were hesitant to answer unfamiliar phone numbers or engage with the government.
Increased use of culture-independent diagnostic tests (CIDTs) in clinical laboratories placed a greater burden on public health laboratories (PHLs). They needed to process more stool specimens, extending the time to complete sequencing to detect outbreaks of enteric illnesses.
Staff capacity remained limited, and many state and local agencies continued to experience high turnover. For example, PHLs have had increased difficulty recruiting, hiring, and retaining experienced microbiologists. Less laboratory scientists are classically trained in microbiology because of fewer training programs and clinical laboratories no longer culturing isolates, requiring the need for more classically trained microbiologists.
Despite these obstacles, FoodCORE centers embraced opportunities and new technologies, and focused on rebuilding trust with the public. The COVID-19 response emphasized a critical need to improve data systems and make data transparent, accessible, and equitable. FoodCORE staff implemented strategies, like WhatsApp or mailing letters, to reach cases and continued leveraging their student teams for enhanced capacity. Applications like Slack and Microsoft Teams helped maintain strong, real-time collaboration and communication. Finally, health officials explored the power of Artificial Intelligence and its potential for public health.
Public health officials at the FoodCORE centers face challenges keeping people safe and healthy while working with limited staff and resources. FoodCORE resources support public health capacity leading to faster identification and control of more local and multistate foodborne disease outbreaks.
FoodCORE activities
FoodCORE increases the safety of people's food, water, and environment. FoodCORE resources are used to detect and respond to outbreaks, train public health professionals, and strengthen health systems.
Model practices and success stories allow non-FoodCORE jurisdictions to use the methodologies and practices that have been successful in FoodCORE centers. Four FoodCORE model practices have been published on processes used by FoodCORE centers so that others can replicate their successes.
FoodCORE success stories document the work that centers do to advance public health including novel approaches to surveillance and investigation. In 2023, a success story recognized South Carolina's work stopping a Shiga toxin-producing Escherichia coli (STEC) outbreak.
Each year, FoodCORE staff at CDC and in FoodCORE centers share progress and updates at national meetings and conferences; this includes the Council of State and Territorial Epidemiologists (CSTE) conference and the Integrated Foodborne Outbreak Response and Management (InFORM) meetings. Notably, in 2023, FoodCORE staff were involved in a CSTE position statement that made invasive Cronobacter infection among infants nationally notifiable.
Program performance
Centers report metrics once a year to document changes resulting from targeted FoodCORE resources. Metrics for Salmonella, STEC, and Listeria (SSL) have been collected since late 2010. Metrics for norovirus, other etiologies, and unknown etiology (NOU) investigations have been collected since 2012. The metrics collected by FoodCORE centers are revised as needed to best meet program goals.
Graphs for selected metrics - Year Thirteen
Figure 1
The expansion of culture-independent diagnostic tests (CIDTs) without reflex culture in clinical laboratories has placed a greater burden of isolate recovery on public health laboratories (PHLs). Since Year 7, the mean number of specimens or samples submitted to the PHLs has increased (2a)[A] while the mean proportion of Salmonella, STEC, Shigella, and Campylobacter specimens or samples that were isolate-yielding decreased (2b)[B].
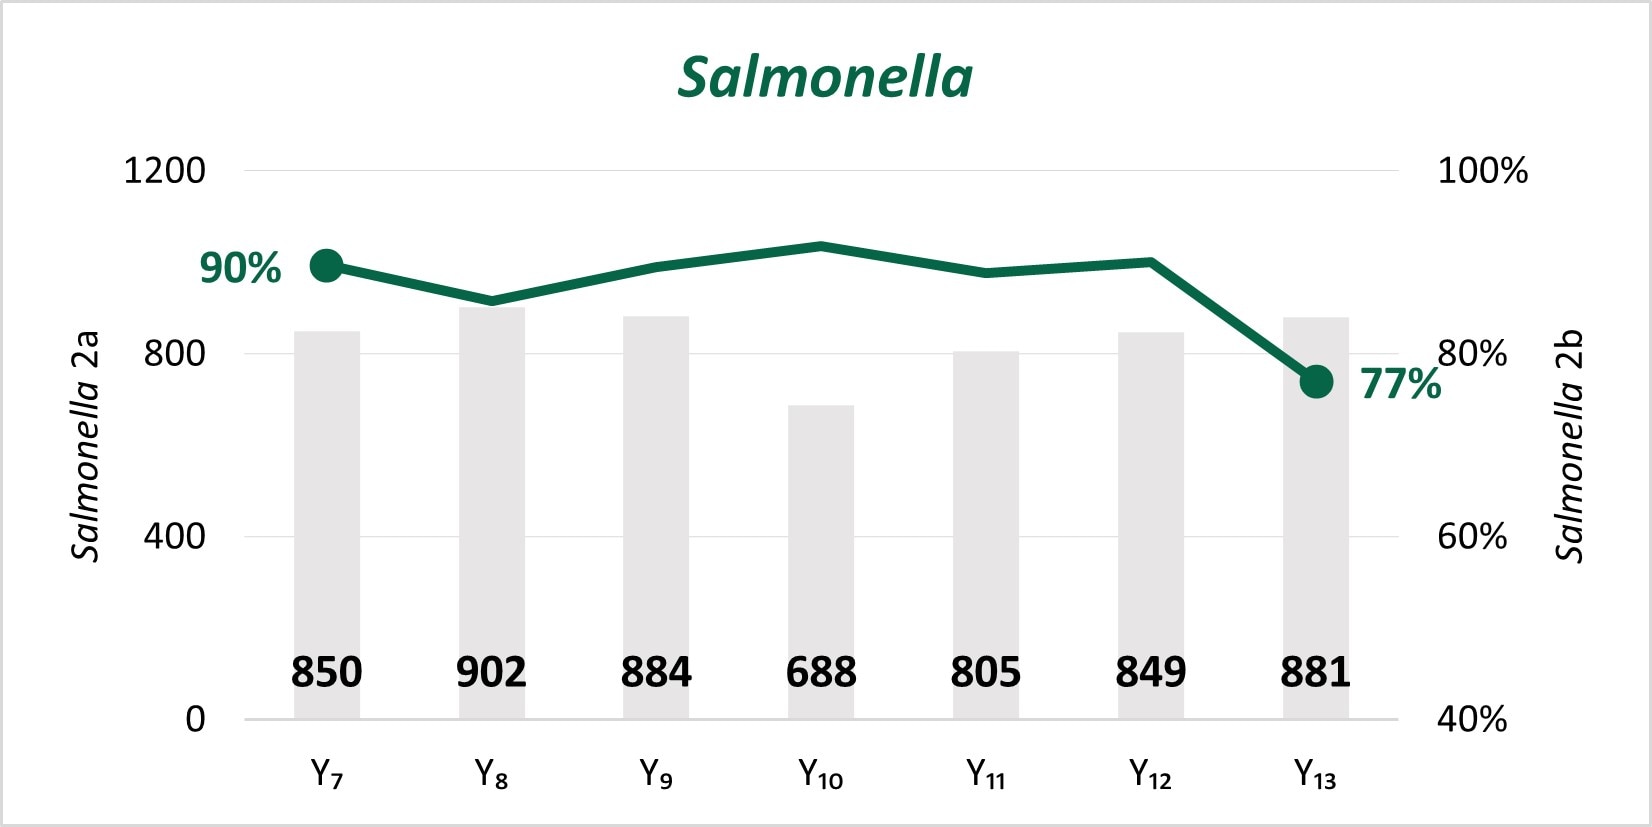
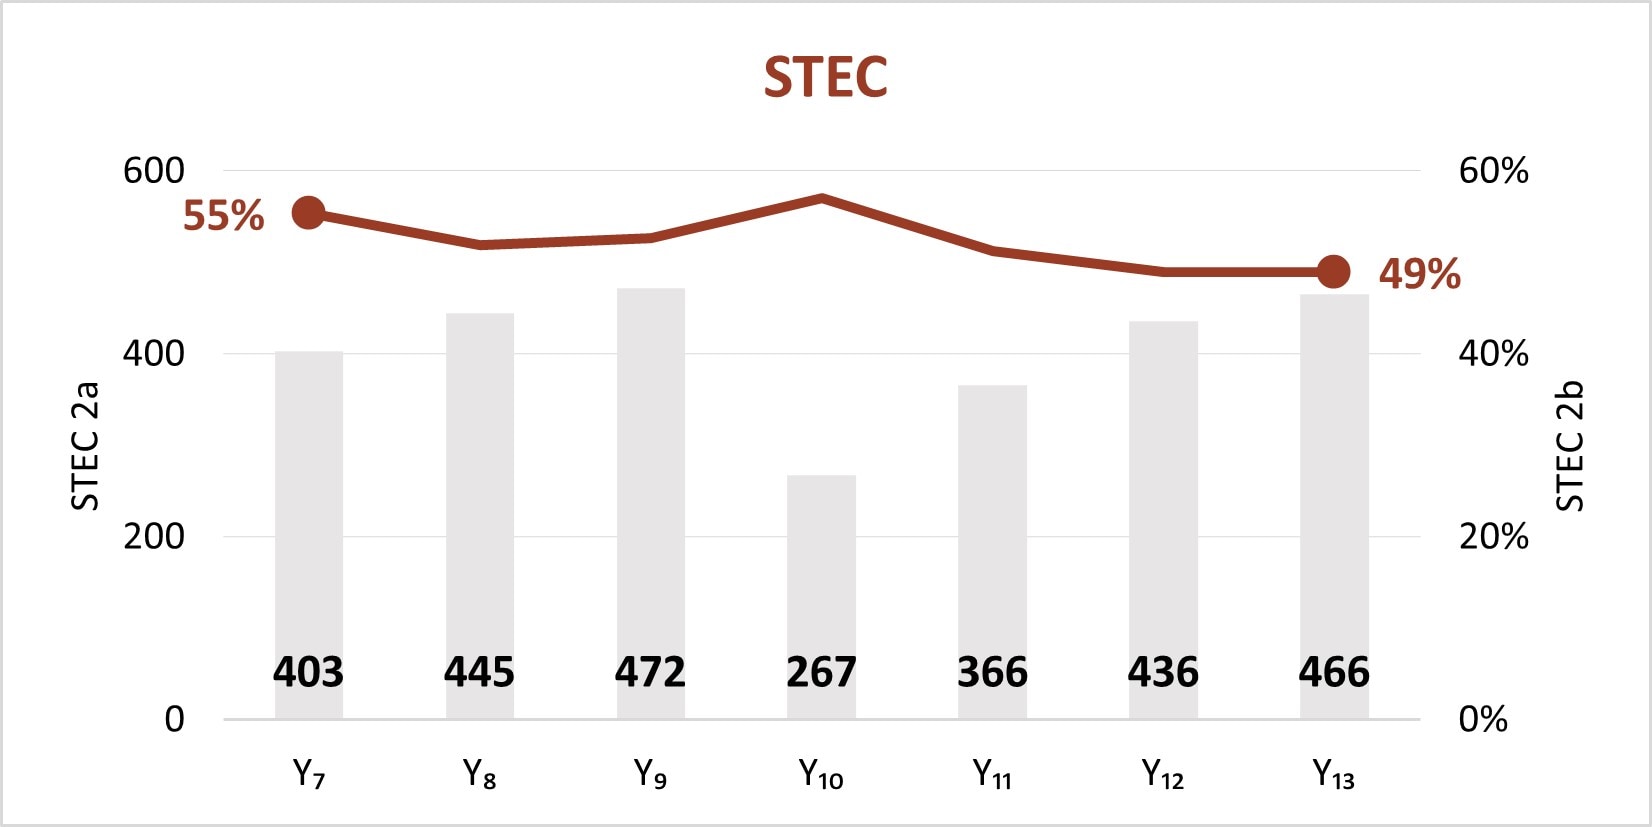
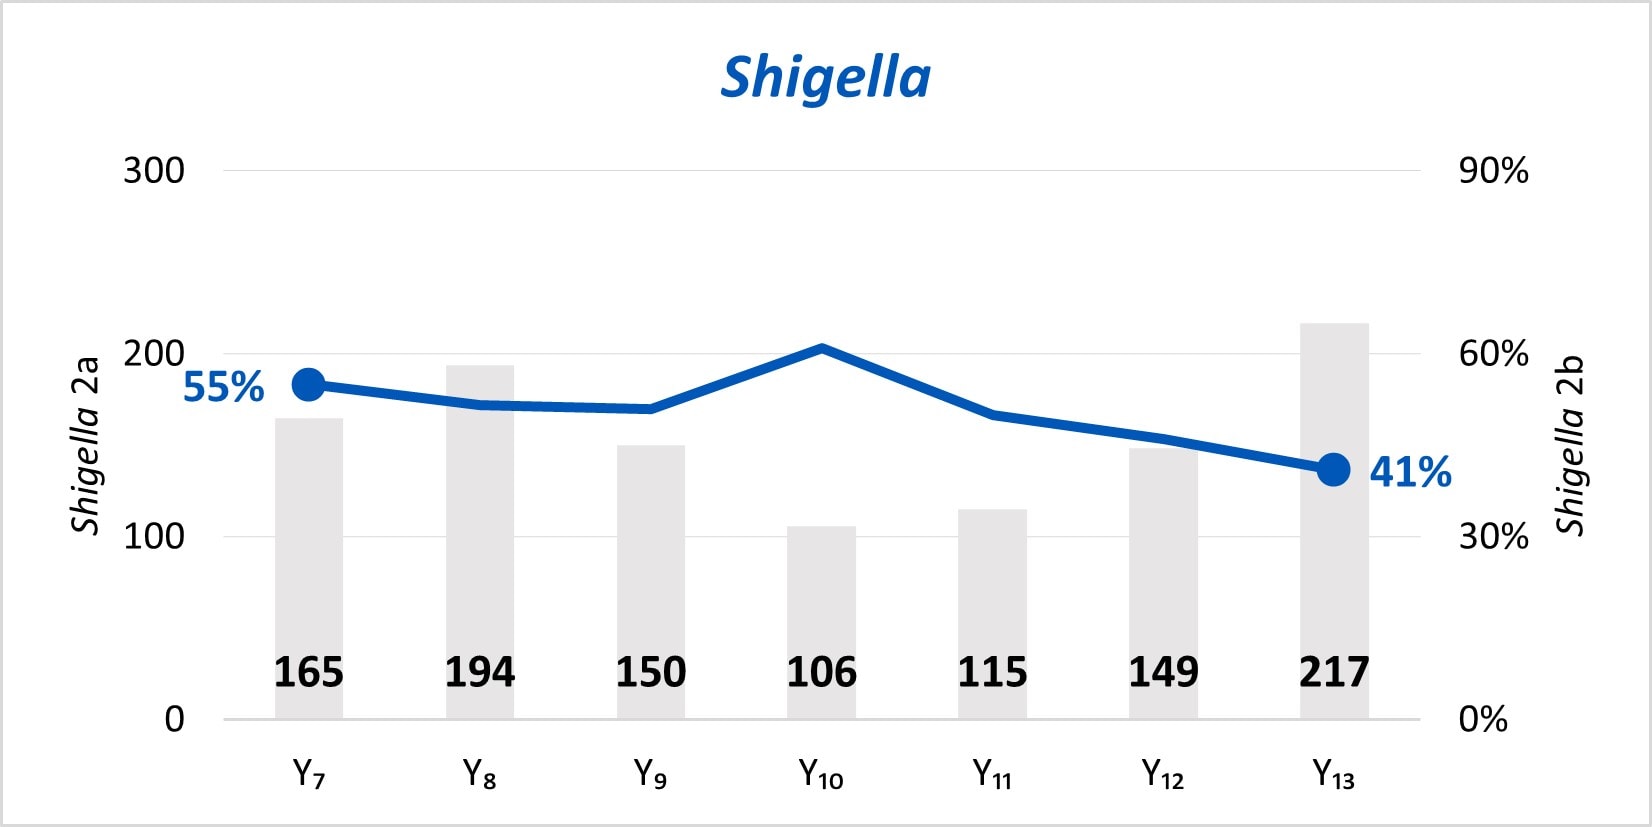
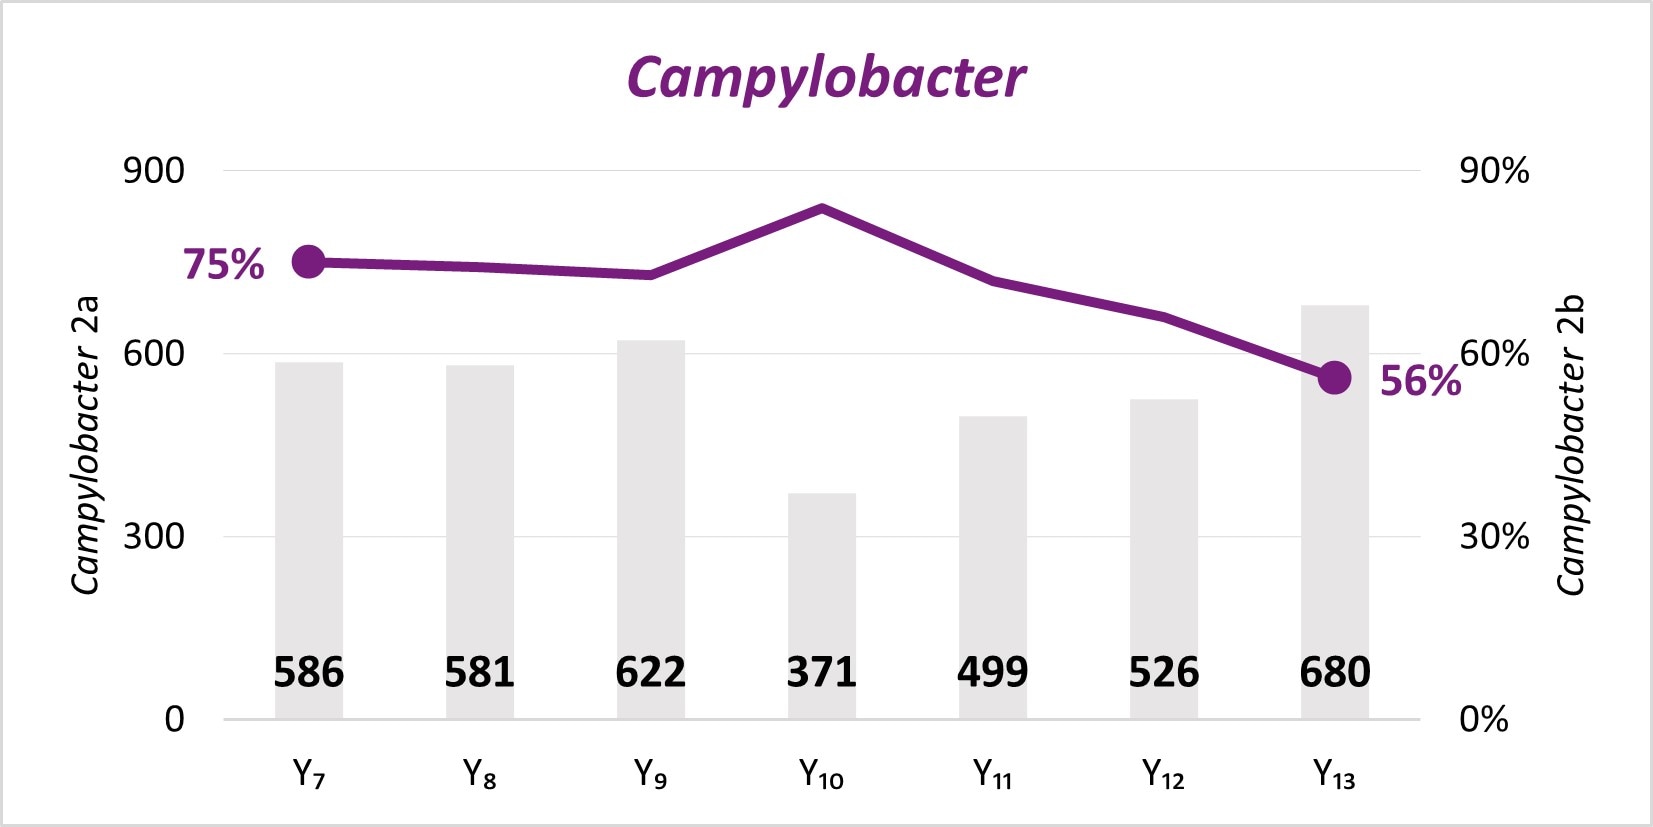
Figure 2
In the early years of whole genome sequencing (WGS) implementation, the mean turnaround time (TAT)[C] from receipt or recovery at the WGS laboratory to the sequence being shared with the national database peaked in Year 7 for Salmonella, STEC, and Listeria. Since Year 9, a faster TAT has been maintained.
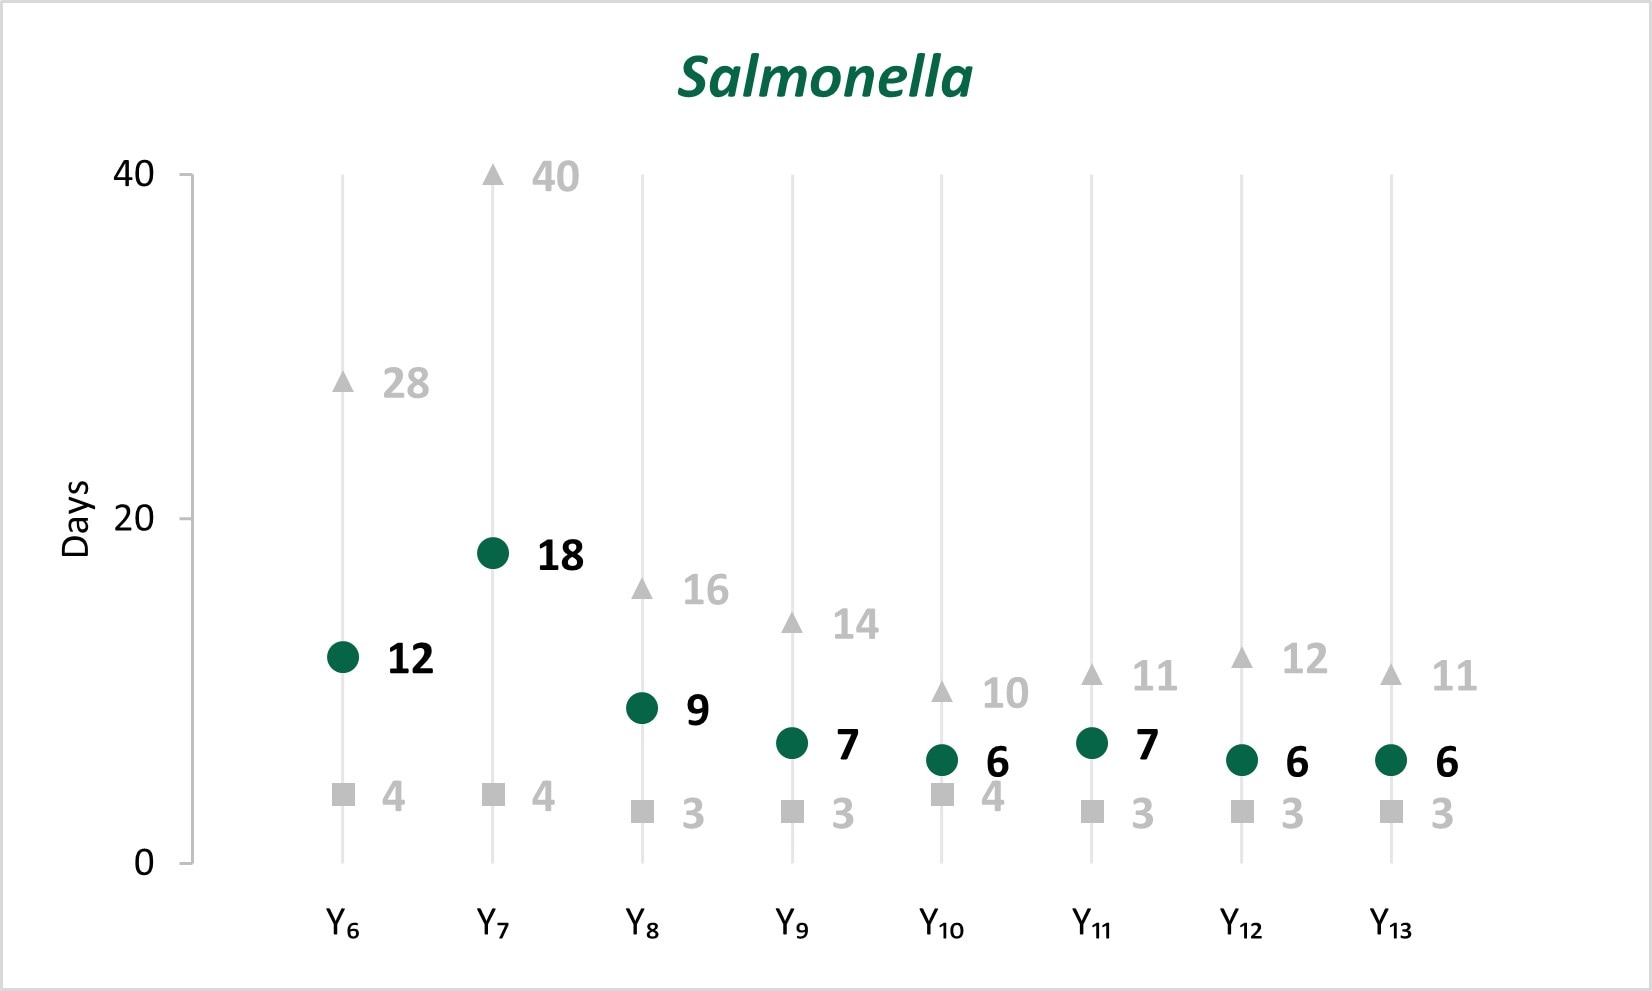
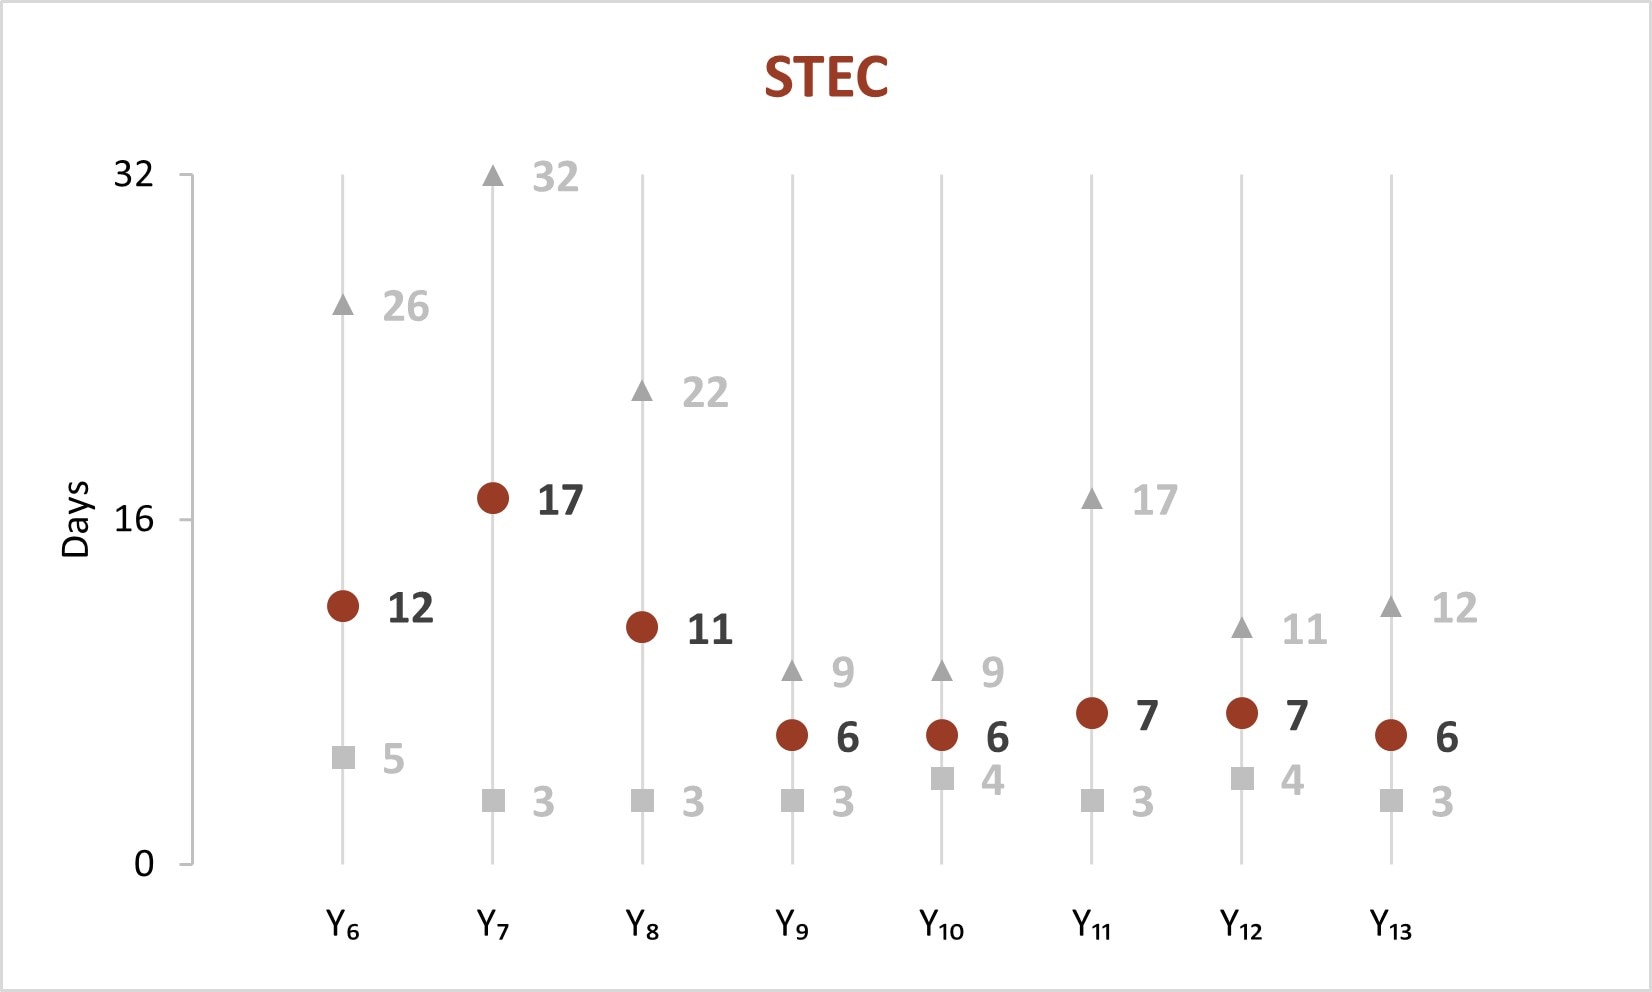

Figure 3
In Year 13, the time[[C]] to attempt and complete interviews for Salmonella, STEC, and Listeria was under 1 day and 5 days, respectively.
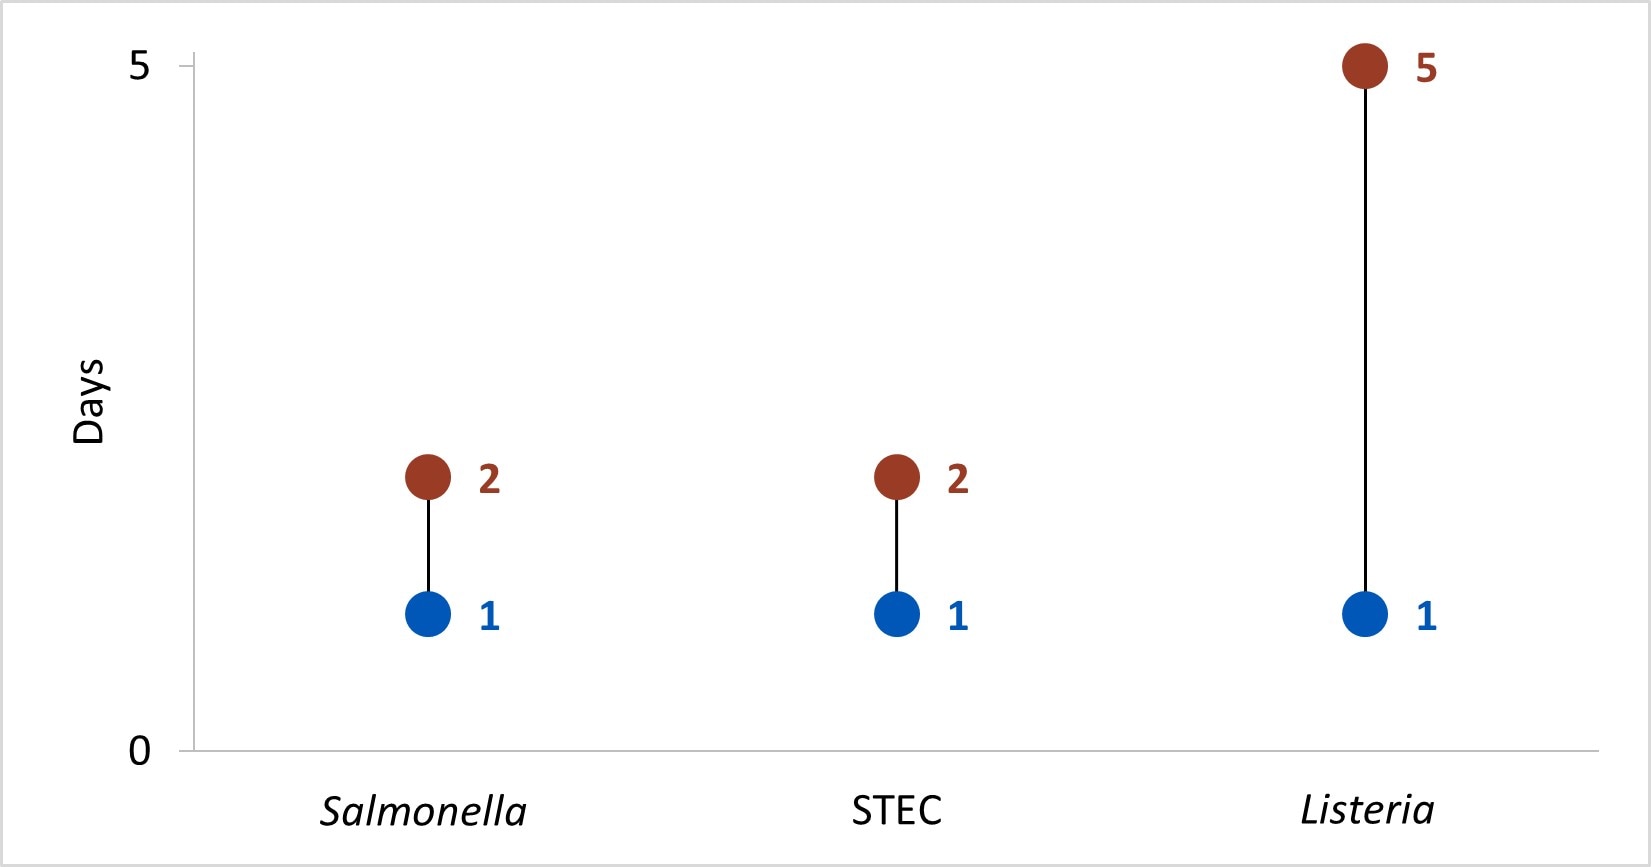
Figure 4
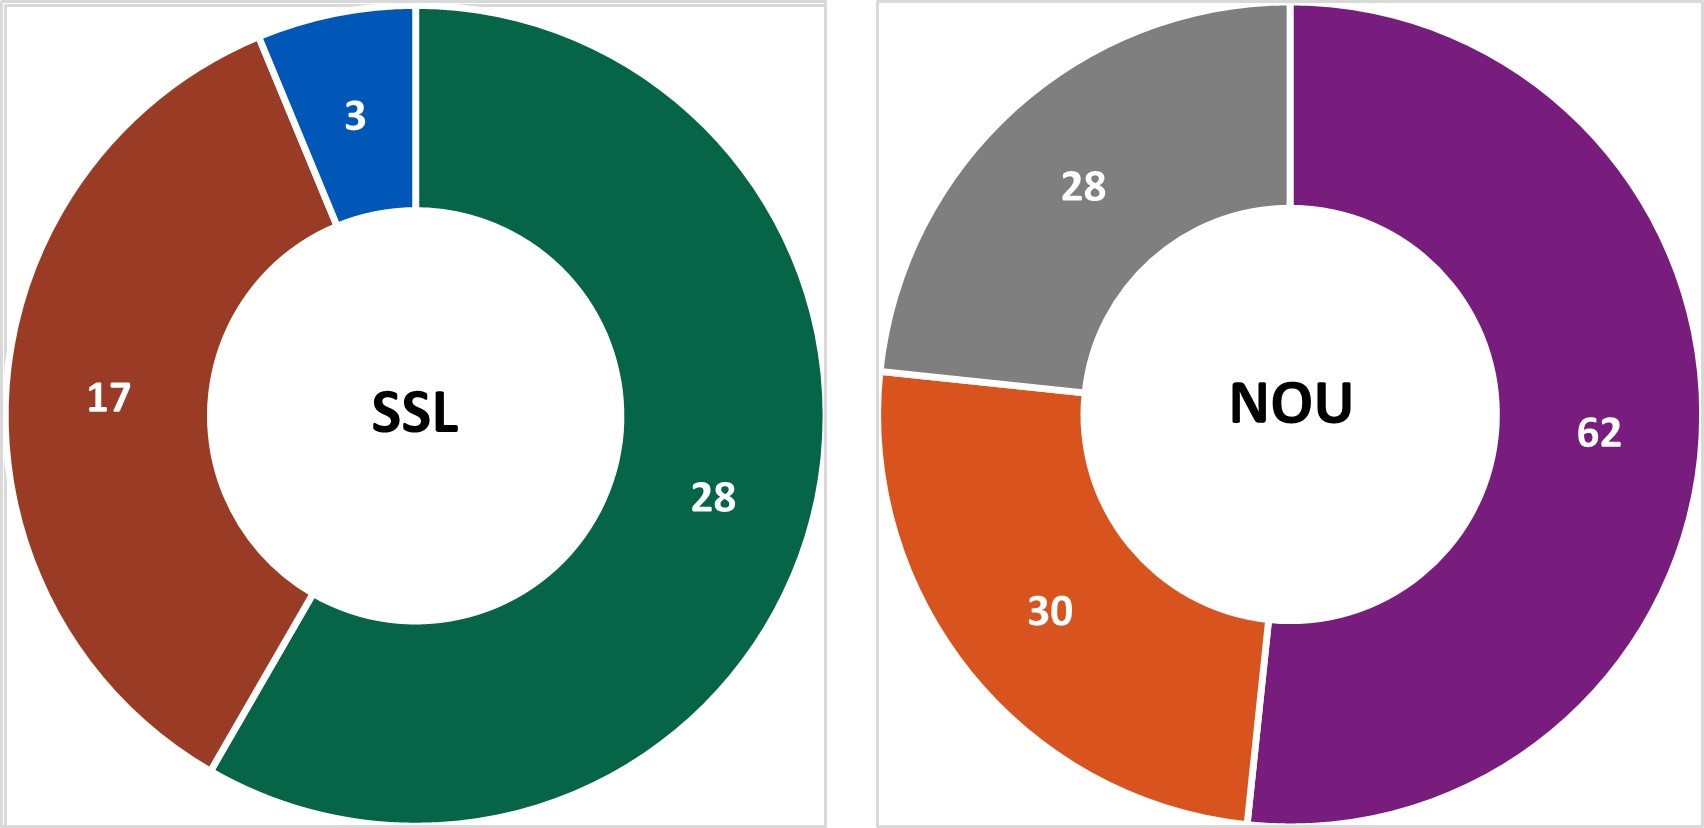
In Year 13, centers conducted 48 SSL and 120 NOU[D] environmental health assessments as part of investigations where there was a link to a common location of exposures.
- Baseline (Y0) = Oct 2010 – Mar 2011
- Year 1 (Y1) = Oct 2010 – Sept 2011
- Year 2 (Y2) = Oct 2011 – Dec 2012
- Year 3 (Y3) = Jan 2013 – Dec 2013
- Year 4 (Y4) = Jan 2014 – Dec 2014
- Year 5 (Y5) = Jan 2015 – Dec 2015
- Year 6 (Y6) = Jan 2016 – Dec 2016
- Year 7 (Y7) = Jan 2017 – Dec 2017
- Year 8 (Y8) = Jan 2018 – Dec 2018
- Year 9 (Y9) = Jan 2019 – Dec 2019
- Year 10 (Y10) = Jan 2020 – Dec 2020
- Year 11 (Y11) = Jan 2021 – Dec 2021
- Year 12 (Y12) = Jan 2022 – Dec 2022
- Year 13 (Y13) = Jan 2023 – Dec 2023
- SSL 2a. Total number of preliminary positive clinical specimens or samples (including, but not limited to CIDT) received at PHL as a specimen or sample (regardless of if isolate-yielding or not)
- SSL 2b. percent of preliminary positive clinical specimens or samples received at the PHL that yielded isolates.
- Time in median days
- Only foodborne and point-source investigations are reported for NOU metrics
