At a glance
- This spotlight was published on September 28, 2023.
- CDC analyzes data on influenza viruses and associated morbidity and mortality each influenza (flu) season.
- This data helps identify the vaccine viruses to be included in the new annual Northern Hemisphere flu vaccines.
- The Food and Drug Administration's Vaccines and Related Biological Products Advisory Committee reviewed and evaluated the data on the 2022–2023 flu season and the performance of the 2022-2023 flu vaccines to determine the composition of the 2023–2024 U.S. flu vaccines.
Executive summary
The Centers for Disease Control and Prevention (CDC) collects, compiles, and analyzes data on influenza viruses and associated morbidity and mortality in the United States. Influenza activity in the United States during the 2022–2023 season (October 2, 2022–September 9, 2023) was moderately severe and was characterized by activity that returned to pre-COVID-19 levels but occurred earlier than is usual. Influenza A(H3N2) viruses were the predominant virus subtype circulating during the single wave of activity that peaked in late November and early December; however, influenza A(H1N1)pdm09 and influenza B/Victoria viruses also were reported.
This report describes the extent and timing of influenza activity in the United States during the 2022–2023 influenza season (October 2, 2022–September 9, 2023) as reported to CDC by clinical and public health laboratories, outpatient providers, emergency departments, hospitals, vital statistics offices, and public health departments. It also includes the composition of the Northern Hemisphere 2023–2024 influenza vaccines and a brief update on influenza activity occurring during the summer of 2023 in the Southern Hemisphere.
Virologic surveillance
U.S. World Health Organization (WHO) collaborating laboratories and National Respiratory and Enteric Virus Surveillance System (NREVSS) laboratories, which include both clinical and public health laboratories throughout the United States, contribute to virologic surveillance for influenza1. During the 2022–2023 influenza season, the included clinical laboratories tested 4,023,390 respiratory specimens for influenza viruses using clinical diagnostic tests. Among these, 358,781 (8.9%) specimens tested positive, including 349,050 (97.3%) for influenza A and 9,731 (2.7%) for influenza B viruses. The percentage of specimens testing positive for influenza each week ranged from 0.7% to 26.3% and peaked during the week ending December 10, 2022 (week 49) (Figure 1). Public health laboratories tested 283,440 specimens and reported 30,993 positive specimens, with 29,552 (95.4%) positive for influenza A and 1,441 (4.6%) positive for influenza B viruses. Among 25,160 seasonal influenza A viruses that were subtyped, 7,465 (29.7%) were influenza A(H1N1)pdm09 viruses, and 17,695 (70.3%) were influenza A(H3N2) viruses. Influenza B lineage information was available for 1,168 (81.1%) influenza B viruses, with all of them belonging to the Victoria lineage. No influenza B/Yamagata lineage viruses were identified.
The 2022–2023 influenza season was characterized by an early increase in seasonal influenza activity, with activity increasing nationally early in October 2022 and peaking in early December 2022 (Figure 1). Based on the percentage of specimens testing positive in clinical laboratories, all 10 Health and Human Services (HHS) regions experienced a single wave of influenza activity that peaked between early November and mid-December: HHS Region 4 (Southeast) peaked in early November; Regions 1, 2, 3, 9 and 10 (New England, New York/New Jersey/Puerto Rico, Mid-Atlantic, West Coast, and Pacific Northwest) peaked in late November; Regions 6 and 7 (South Central and Central) peaked in early December; and regions 5 and 8 (Midwest and Mountain) peaked in mid-December 2022.
Figure 1. Influenza Positive Test Results Reported by Clinical Laboratories to CDC, National Summary by MMWR week and Influenza Season — United States, 2017–18 to 2022–23 Seasons
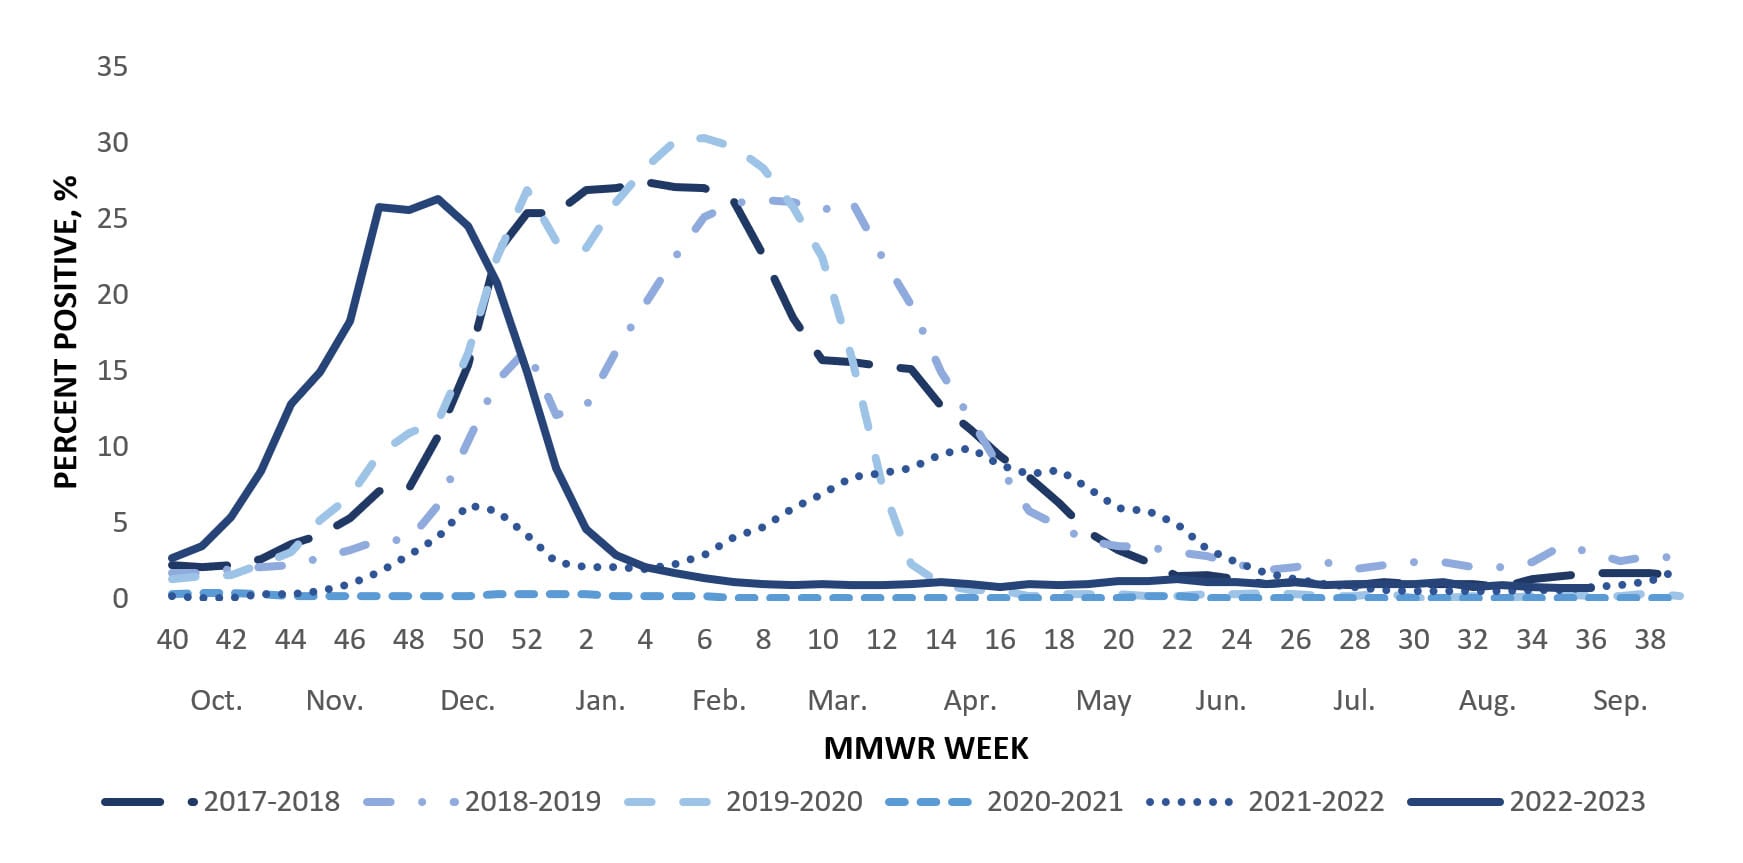
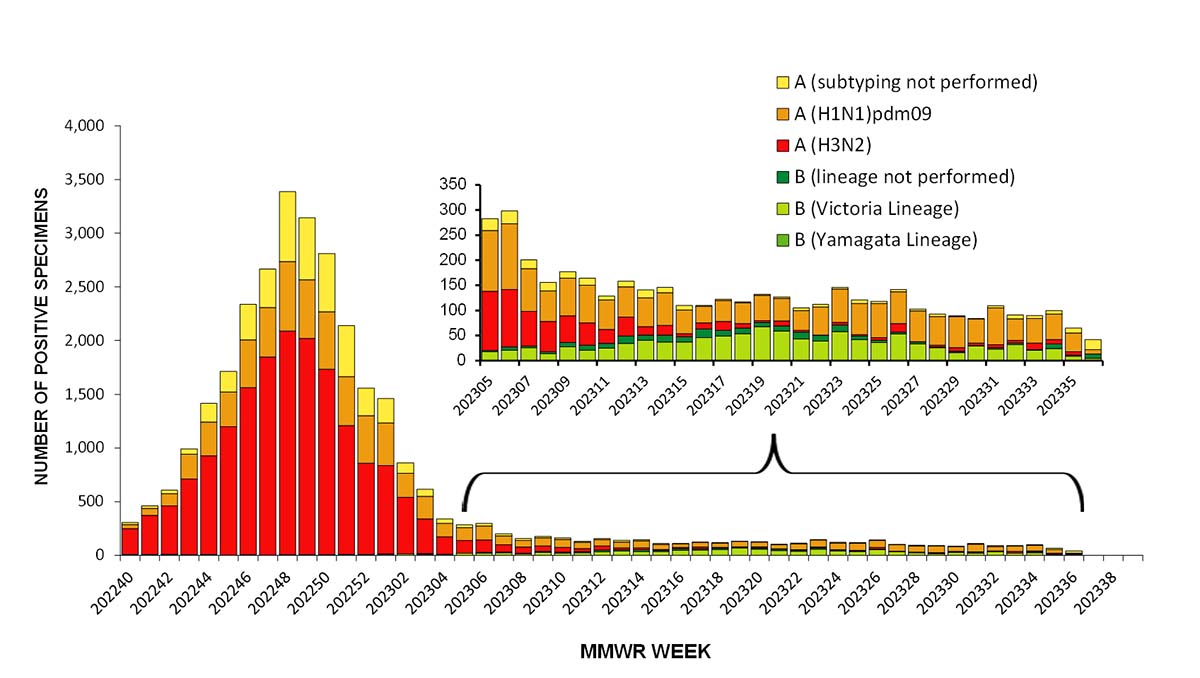
Influenza A(H3N2) was the predominant virus during the 2022–2023 influenza season as a whole and for each week from early October through the end of January. Influenza A(H1N1)pdm09 and influenza B/Victoria viruses circulated at lower levels during the season; however, during the weeks of low virus circulation since February, A(H1N1)pdm09 or B viruses were identified more frequently than A(H3N2) viruses. Since mid-June, A(H1N1)pdm09 viruses have been the predominant virus (Figure 2).
Among the influenza A viruses that were subtyped, influenza A(H3N2) viruses were the most common virus among all age groups; comprising 70.8% of influenza A(H3N2) viruses identified in persons aged 0–4 years, 74.5% in 5–24 years, 61.1% in 25–64 years, and 67.9% in those aged 65 years or older. While A(H3N2) viruses were more common among all age groups, A(H1N1)pdm09 viruses accounted for more than one third (38.9%) of the influenza A detections in persons 25 to 64 years old.
Figure 2. Influenza Positive Tests Reported to CDC by U.S. Public Health Laboratories, National Summary, October 2, 2022 – September 9, 2023
Virus characterization & antiviral susceptibility
Genetic characterization of the viruses circulating during this time period was conducted using next generation sequencing, and the genomic data were analyzed and submitted to publicly accessible databases (GenBank and EpiFlu). Phylogenies of representative subsets of genetic data from CDC and other submitters can be visualized in real time at Next Strains.
To evaluate whether genetic changes in the hemagglutinin (HA) of circulating viruses affected antigenicity, antigenic characterizations were conducted using hemagglutination inhibition (HI) assays (A(H1N1)pdm09 and B viruses) or neutralization-based HINT (A(H3N2) viruses) and post-infection ferret antisera raised to reference viruses representing the 2022–2023 Northern Hemisphere vaccine viruses. Both assays determine how well antibodies raised to the vaccine reference viruses recognize or bind to circulating viruses. HINT measures how well antibodies neutralize or block virus infection of a cell whereas the HI assay measures how well antibodies inhibit the binding between the HA of the virus and the sialic acid receptors on the surface of red blood cells.
CDC genetically characterized 3,370 viruses (2,923 influenza A and 432 influenza B) collected in the United States during October 2, 2022–September 9, 2023, and antigenically characterized viruses representing various genetic clades. Overall, the vaccine antigens for each of the three major groups of the influenza viruses circulating in people (i.e., A(H1N1)pdm09, A(H3N2), and B/Victoria) elicited antibodies that reacted well with most of the co-circulating viruses during this period. Detailed characterization data for each group are below.
Influenza A(H1N1)pdm09
Phylogenetic analysis of the HA demonstrated that all viruses tested belonged to the 6B.1A.5a lineage and were classified in 3 clades. Clade 5a.1 represented less than 1% (n=6), 19% (n=244) were clade 5a.2a, and 80% (n=1,025) were 5a.2a.1. Nearly all (99%, n=432) of the A(H1N1)pdm09 viruses antigenically characterized were well recognized (reacting at titers that were within 8-fold of the homologous virus titer by HI) by ferret antisera to cell-grown A/Wisconsin/588/2019-like reference viruses which represent the A(H1N1)pdm09 component for the cell- and recombinant-based influenza vaccines. Nearly all (99%, n=410) of the A(H1N1)pdm09 viruses antigenically characterized were well recognized by ferret antisera to egg-grown A/Victoria/2570/2019-like reference viruses which represent the A(H1N1)pdm09 component for egg-based influenza vaccines.
Influenza A(H3N2)
All 1,663 genetically characterized A(H3N2) viruses belonged to one of the subclades of the 3C.2a1b.2a.2 clade, with the majority (70%, n=1,162) belonging to the 2b subclade. Antigenic analysis showed that 346 (93%) were well-recognized (reacting at titers that were within 8-fold of the homologous virus titer by HI or HINT) by ferret antisera to cell-grown A/Darwin/6/2021-like reference viruses that represent the A(H3N2) component for the cell- and recombinant-based influenza vaccines. Fewer A(H3N2) viruses (66%, n=176) were well recognized by ferret antisera raised to the egg-grown A/Darwin/9/2021-like reference viruses that represent the A(H3N2) component for egg-based influenza vaccines.
Influenza B
All influenza B viruses for which characterization was possible belonged to the B/Victoria-lineage. Infections with B/Yamagata viruses have not been identified globally since March of 2020. Phylogenetic analysis of the HA genes showed that 99% (n=426) belonged to clade V1A.3a.2 and 1% (n=6) were clade V1A.3. Antigenic analysis showed that 98% (n=154) were well recognized by both ferret antisera to cell-grown and egg-grown B/Austria/1359417/2021-like reference viruses that represent the B/Victoria-lineage component for the cell- and recombinant-based and egg-based influenza vaccines.
CDC also assesses susceptibility of influenza viruses to antiviral medications. Between October 2, 2022 and September 9, 2023, a total of 3,344 viruses collected in the United States were genetically characterized for susceptibility to neuraminidase inhibitors, and a subset of 369 (11%) were tested phenotypically. All genetically characterized viruses lacked known mutations associated with resistance to the neuraminidase inhibitors, except one A(H1N1)pdm09 virus that had an NA-S247G amino acid substitution and one A(H1N1)pdm09 virus that had a mix of amino acids (H and Y) at position 275 of the NA. All viruses tested phenotypically showed normal inhibition by neuraminidase inhibitors, except the A(H1N1)pdm09 virus with NA-S247G that displayed reduced inhibition by oseltamivir and the A(H1N1)pdm09 virus with mix NA-H275H/Y that displayed reduced inhibition by oseltamivir and peramivir. A total of 3,213 viruses were genetically characterized for susceptibility to the polymerase acidic (PA) cap-dependent endonuclease inhibitor baloxavir, and a subset of 372 (11.6%) were tested phenotypically. One A(H1N1)pdm09 virus had a PA-E199G amino acid substitution, which conferred reduced baloxavir susceptibility, and all remaining tested viruses were susceptible to baloxavir.
Table 1. Assessment of Virus Susceptibility to Antiviral Medications, Viruses Collected in the U.S. October 2, 2022–September 9, 2023
Vaccine strain selection 2023–2024
Viruses to be included in the 2023–2024 Northern Hemisphere influenza vaccines were recommended at the World Health Organization’s Consultation on the Composition of the Influenza Vaccines in February 2023 and selected by the Food and Drug Administration’s Vaccines and Related Biological Products Advisory Committee in March 2023 after reviewing and evaluating data on the 2022–2023 influenza season and the performance of the 2022–2023 influenza vaccines23. The A(H3N2), B/Victoria lineage and B/Yamagata lineage components are unchanged from the 2022–2023 Northern Hemisphere influenza vaccines. Both the egg-based and cell- or recombinant-based vaccines had a change in the A(H1N1)pdm09 component. In the egg-based vaccine it was changed to an A/Victoria/4897/2022 (H1N1)pdm09-like virus and in cell- or recombinant-based vaccines it was changed to an A/Wisconsin/67/2022 (H1N1)pdm09-like virus23. The genetic clade and subclade for the recommended vaccine viruses were 5a.2a.1 for A(H1N1)pdm09, 3C.2a1b.2a.2 for A(H3N2), V1A.3a.2 for B/Victoria, and Y3 for B/Yamagata.
Table 2. Influenza Vaccine Viruses Northern Hemisphere 2022–2023 and 2023–2024 Seasons.
Novel influenza A viruses
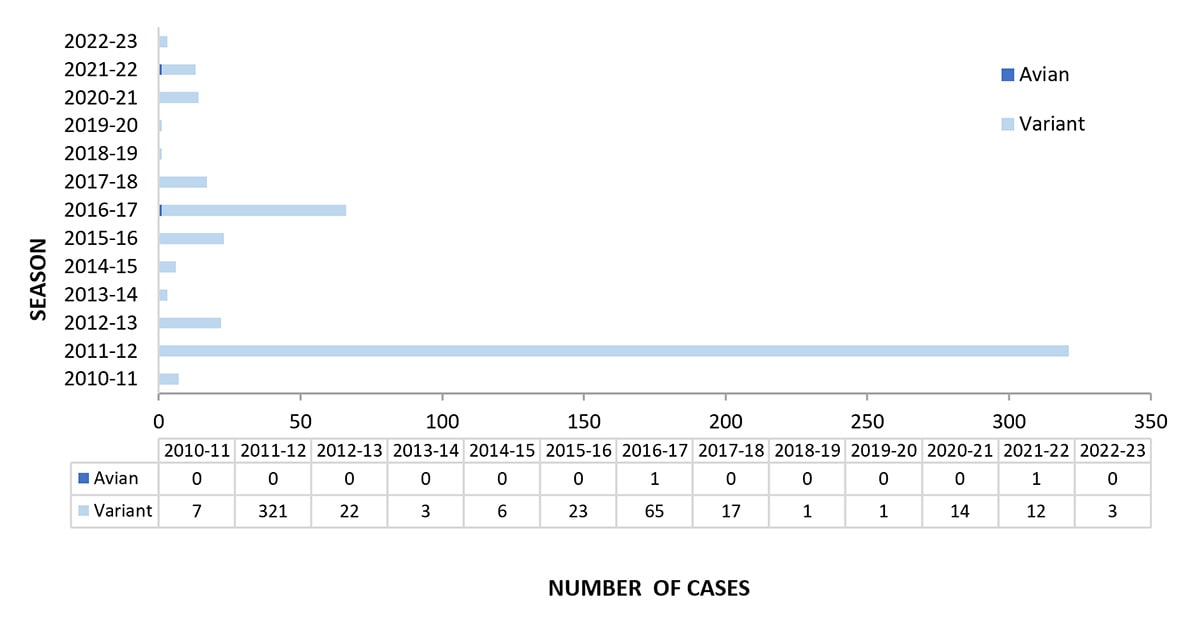
Novel influenza viruses are influenza A virus subtypes that are different from currently circulating human seasonal influenza H1 and H3 viruses. From October 2, 2022, through September 9, 2023, three novel influenza A viruses were detected in persons and reported to CDC (Figure 3). All three were variant viruses (i.e., a swine influenza virus identified in a human and designated with a "v"). One influenza A(H3N2)v virus was identified in New Mexico in October 2022; two variant viruses were identified in Michigan in July 2023 (one A(H1N2)v virus and one A(H3)v virus). All three viruses were detected in children younger than 18 years, and all three patients had swine exposure prior to illness onset. No person-to-person transmission of variant influenza A viruses associated with these patients was identified.
CDC continues to monitor highly pathogenic avian influenza (HPAI) A(H5N1) viruses in wild birds and poultry in the United States. An updated technical report summarizing the current state of HPAI A(H5N1) virus, published on July 7, 2023, detailed virus activity and actions CDC and the U.S. Government are taking in response to the virus.4 Despite continued identification of HPAI A(H5N1) viruses in birds and mammals, no avian influenza viruses were detected in humans in the United States during the 2022–2023 season.
Figure 3. Novel Influenza A Virus Cases by Season— United States, 2010-11 to 2022-23 Seasons
Outpatient respiratory illness surveillance
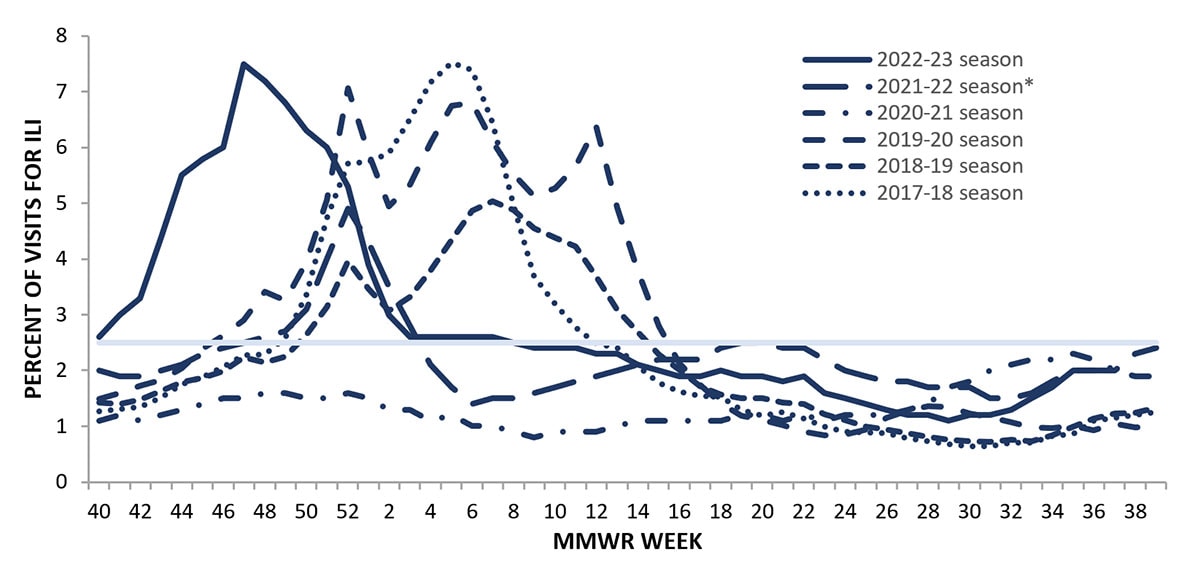
Information on outpatient visits to health care providers for respiratory illness referred to as influenza-like illness ([ILI], fever plus cough or sore throat) is collected through the U.S. Outpatient Influenza-like Illness Surveillance Network (ILINet).1 Nationally, the weekly percentage of outpatient visits for ILI recorded in ILINet was at or above the national baseline of 2.5% for 21 consecutive weeks from October 2022 to March 2023 and peaked at 7.5% during the week ending November 26, 2022 (week 47) (Figure 4). This was the earliest peak activity associated with seasonal influenza recorded in ILINet since the system began in 1997. ILI activity peaked in all 10 HHS Regions during the week ending November 26, 2022 (week 47), but the number of weeks of elevated activity (weeks above the region-specific baseline) varied. Region 9 (West Coast) had ILI activity above baseline for 34 weeks while the remaining 9 HHS Regions were above baseline for 21 weeks or less. Multiple respiratory viruses cocirculated during the 2022–2023 season and the contribution of influenza viruses to ILI likely varied by week and location. ILI activity during the 2022–2023 season returned to levels that were more similar to those seen before the COVID-19 pandemic which may be attributed to respiratory virus circulation and healthcare seeking behavior that was more similar to pre-COVID seasons than what occurred during the 2020–2021 and 2021–2022 seasons.
Figure 4. Percentage of Outpatient Visits for Respiratory Illness as Reported by ILINet, National Summary by Season — United States, 2017–2018 to 2022–2023 Seasons
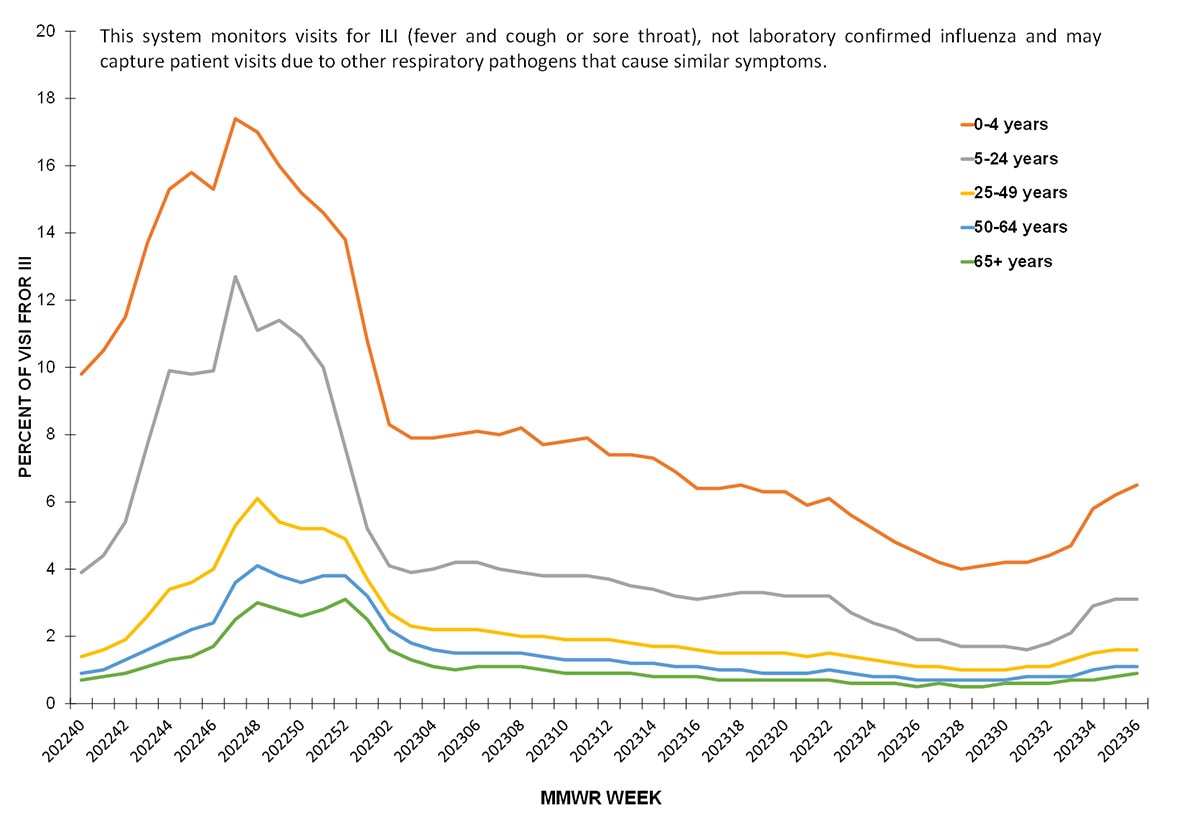
About 70% of ILINet providers report total number of patient visits, as well as ILI visits, by age group, allowing the calculation of percentage of visits for ILI by age group. Both pediatric age groups (0–4 years and 5–24 years) had a higher percentage of visits for ILI compared to the adult age groups throughout the season. Peak activity among the pediatric population occurred during the week ending November 26, 2022 (week 47) (17.4% among 0–4 years and 12.7% among 5–24 years). ILI activity among adults peaked during the week ending December 3, 2022 (week 48) and ranged from 6.1% among those 25–49 years to 3.0% among those ≥65 years.
Figure 5. Percentage of Outpatient Visits by Age Group for Respiratory Illness as Reported by ILINet—United States, October 2, 2022–September 9, 2023
ILINet data are used to produce weekly jurisdiction and core-based statistical area (CBSA)-level measures of ILI activity. From the 2008–2009 season through the 2018–2019 season ILI activity categories ranged from minimal to high; during the 2019–2020 season the very high category was added1. For the weeks ending November 26, 2022–December 31, 2022 (weeks 47–52), more than 70% of the 56 jurisdictions experienced high or very high ILI activity each week, with the highest number (46; 82.1%) occurring during the week ending November 26, 2022 (week 47). During the previous two influenza seasons (2021–2022 and 2020–2021), the peak number of jurisdictions experiencing high or very high ILI activity during a single week was 3 (5.5%); however, among the three seasons before the COVID-19 pandemic, the peak number of jurisdictions experiencing high or very high activity during a single week ranged from 33 (60.0%) during the 2018–2019 season to 47 (85.5%) during the 2019–2020 season.
Long-term care facility (LTCF) surveillance
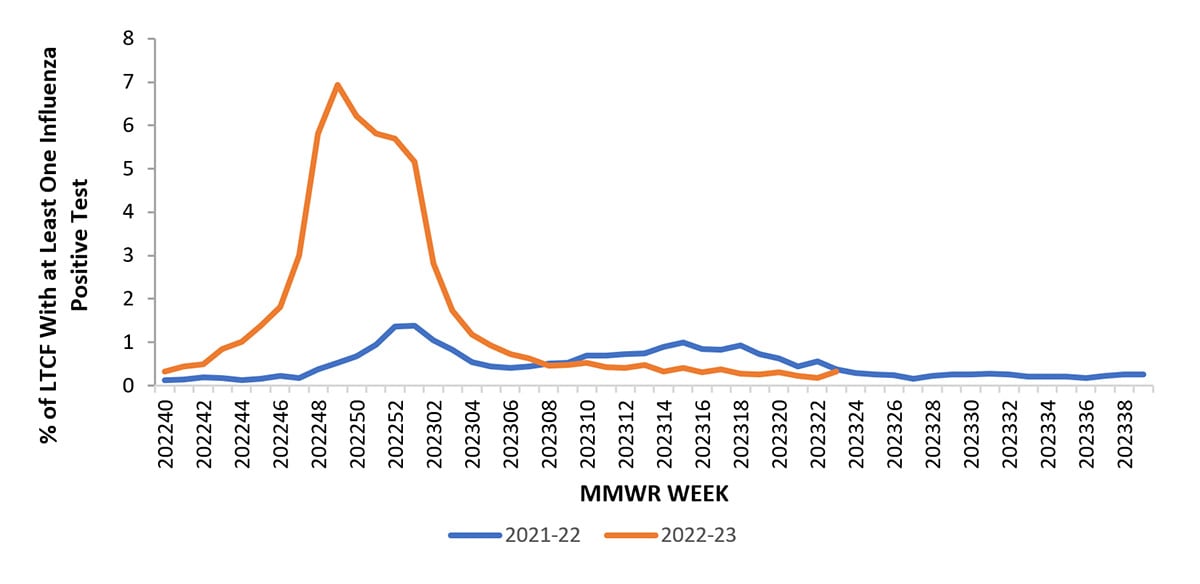
LTCFs (e.g., nursing homes/skilled nursing, long-term care for the developmentally disabled, and assisted living facilities) from all 50 states and U.S. territories report data on influenza virus infections among residents through the National Healthcare Safety Network (NHSN) Long-term Care Facility Component1. During the 2022–2023 season, the weekly percentage of facilities reporting at least one influenza-positive test result among residents ranged from 0.2% to 6.9% nationally and peaked during the week ending December 10, 2023 (week 49). HHS Regions 2–10 (New York/New Jersey/Puerto Rico, Mid-Atlantic, Southeast, Midwest, South Central, Central, Mountain, West Coast, and Pacific Northwest) experienced peak activity during the week ending December 10, 2023 (week 49), while Region 1 (New England) peaked during the week ending December 31, 2023 (week 52). This season's activity was higher and peaked earlier compared to the 2021–2022 season when activity peaked at 1.4% during early January (Figure 6).
Figure 6. Percent of Long-Term Care Facilities with at Least One Influenza Positive Test Among Residents, Reported to the CDC's National Healthcare Safety Network (NHSN) — United States, 2021–2022 to 2022–2023* Seasons
Hospitalization surveillance
CDC monitors hospitalizations associated with laboratory-confirmed influenza virus infections through two surveillance systems: the Influenza Hospitalization Surveillance Network (FluSurv-NET), which covers approximately 9% of the U.S. population, and NHSN Hospitalization Surveillance (previously referred to as HHS Protect Hospitalization Surveillance), which consists of reports from all hospitals across the country1.
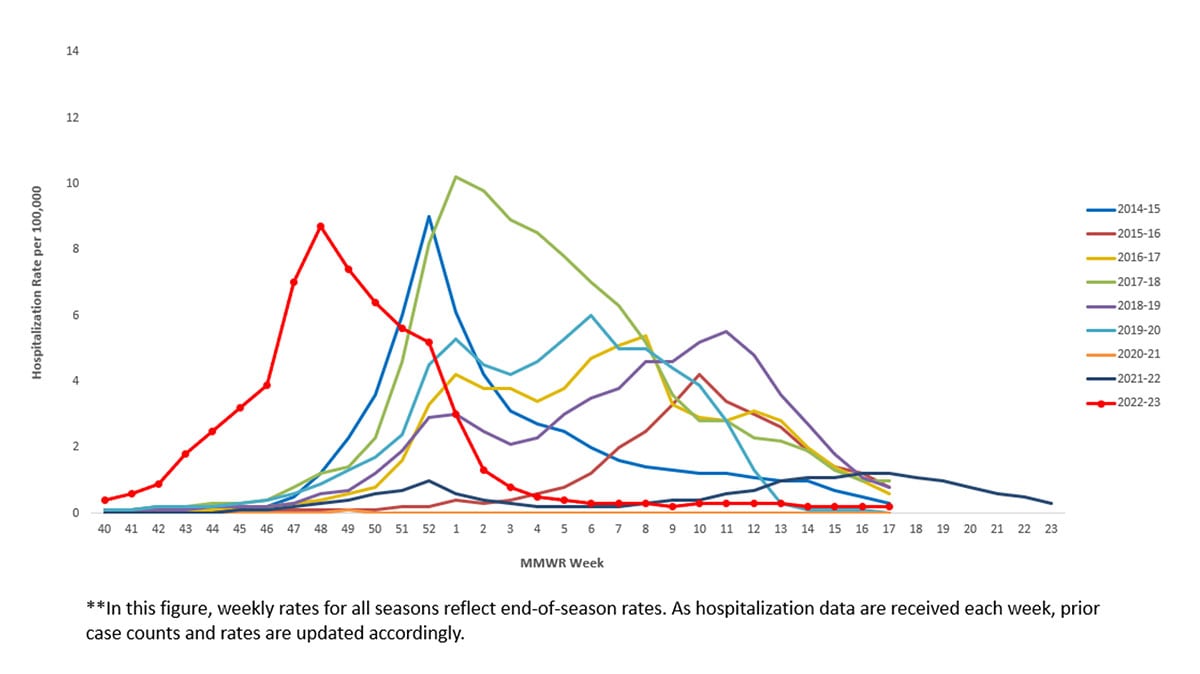
During October 1, 2022–April 30, 2023, the last day of FluSurv-NET active monitoring during the 2022–2023 season, a total of 18,269 laboratory-confirmed influenza-related hospitalizations were reported by FluSurv-NET sites. Hospitalization rates peaked nationally during the week ending December 3, 2022 (week 48), at 8.7 per 100,000 population. This is the third highest weekly rate observed during all seasons going back to 2010–2011; this follows the 2017–2018 season, which peaked at 10.2 per 100,000 during the week ending January 6, 2018 (week 1) and the 2014–2015 season which peaked at 9.0 per 100,000 during the week ending December 27, 2014 (week 52).
Figure 7. Weekly Rate of Laboratory Confirmed Influenza Hospitalizations—United States, 2014–2015 to 2022–2023**
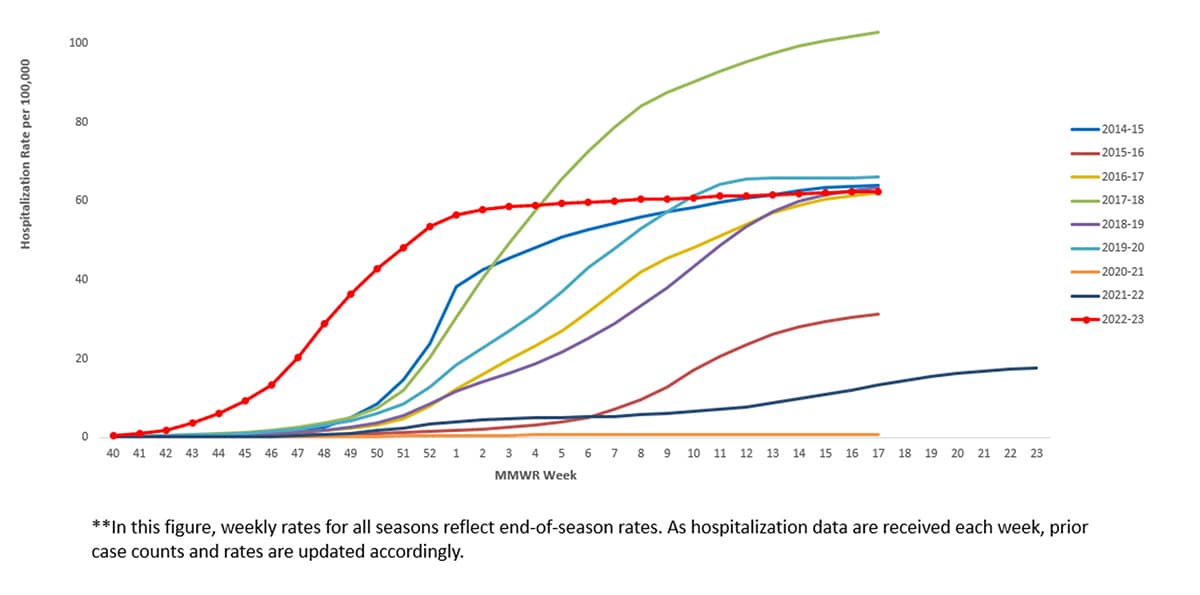
The overall cumulative hospitalization rate for the 2022–2023 was 62.4 per 100,000 population. The 2022–2023 season’s cumulative hospitalization rate was similar to hospitalization rates for 4 prior seasons (the 2014–2015, 2016–2017, 2018–2019, and 2019–2020 seasons) and was higher than hospitalization rates for all other seasons since 2010, except the 2017–2018 season.
Figure 8. Cumulative Rate of Laboratory Confirmed Hospitalizations — United States, 2014–2015 to 2022–2023**
When examining rates by age, the highest rate of hospitalization per 100,000 population was among adults aged ≥65 years (187.3), followed by children aged 0–4 years (80.6), adults aged 50–64 years (67.9), children and adolescents aged 5–17 years (29.5), and was lowest among adults aged 18–49 years (27.2). Most (95.6%) influenza-related hospitalizations were associated with influenza A viruses, and 75.1% of those subtyped were A(H3N2)] viruses. When examining rates by race and ethnicity, the highest rate of hospitalization per 100,000 population was among non-Hispanic Black persons (89.3), followed by non-Hispanic American Indian or Alaska Native persons (85.6), Hispanic/Latino persons (57.7), non-Hispanic White persons (55.8), and non-Hispanic Asian/Pacific Islander persons (28.6).
Among 5,390 hospitalized adults with information on underlying medical conditions, 96.8% had at least one reported underlying medical condition; the most commonly reported were hypertension, cardiovascular disease, metabolic disorder, and obesity. Among 1,572 hospitalized women of childbearing age (15–49 years) with information on pregnancy status, 36.0% were pregnant. Among hospitalized children and adolescents with information about underlying conditions, 66.1% reported at least one underlying medical condition; the most commonly reported were asthma, neurologic disease, and obesity.
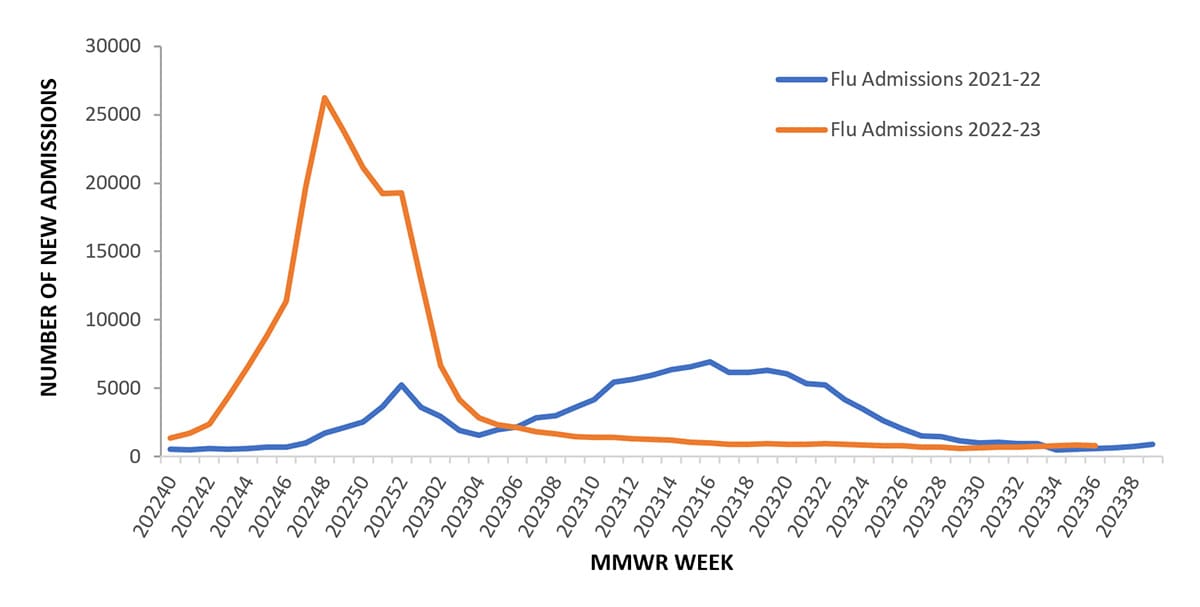
Between October 2, 2022, and September 9, 2023, 226,517 influenza associated hospitalizations were reported to CDC's National Healthcare Safety Network (NHSN) Hospitalization Surveillance Component (previously referred to as HHS Protect Hospitalization Surveillance), with a cumulative rate of 66.0 per 100,000 population for the season. Hospitalizations began to increase in early October, peaking nationally during the week ending December 3, 2022 (week 48) at 26,221 hospitalizations (7.6 per 100,000 population) and declined to interseasonal levels by the end of January 2023. Trends of influenza hospitalizations at the regional level were similar to the national trend with activity in HHS Regions 3, 4, 5, 6, 7 and 9 (Mid-Atlantic, Southeast, Midwest, South Central, Central and West Coast) peaking during early December 2022, Regions 1, 2, and 10 (New England, New York/New Jersey/Puerto Rico, and Pacific Northwest) peaking in mid-December, and Region 8 (Mountain) peaking in late December. The regions with the highest cumulative hospitalization rates for the season were Region 6 (South Central) at 87.7 per 100,000 population, Region 7 (Central) at 79.9 per 100,000 population, and Region 10 (Pacific Northwest) at 77.3 per 100,000 population. The region with the lowest cumulative hospitalization rate was Region 8 (Mountain), at 44.6 per 100,000 population. This season's peak was earlier and higher than what was reported during the 2021–2022 season.
Figure 9. Number of New Influenza Hospital Admissions Reported to the CDC's National Healthcare Safety Network (NHSN) Hospitalization Surveillance Component (previously referred to as HHS Protect Hospitalization Surveillance), National Summary, 2021–2022 to 2022–2023 Seasons
Mortality surveillance
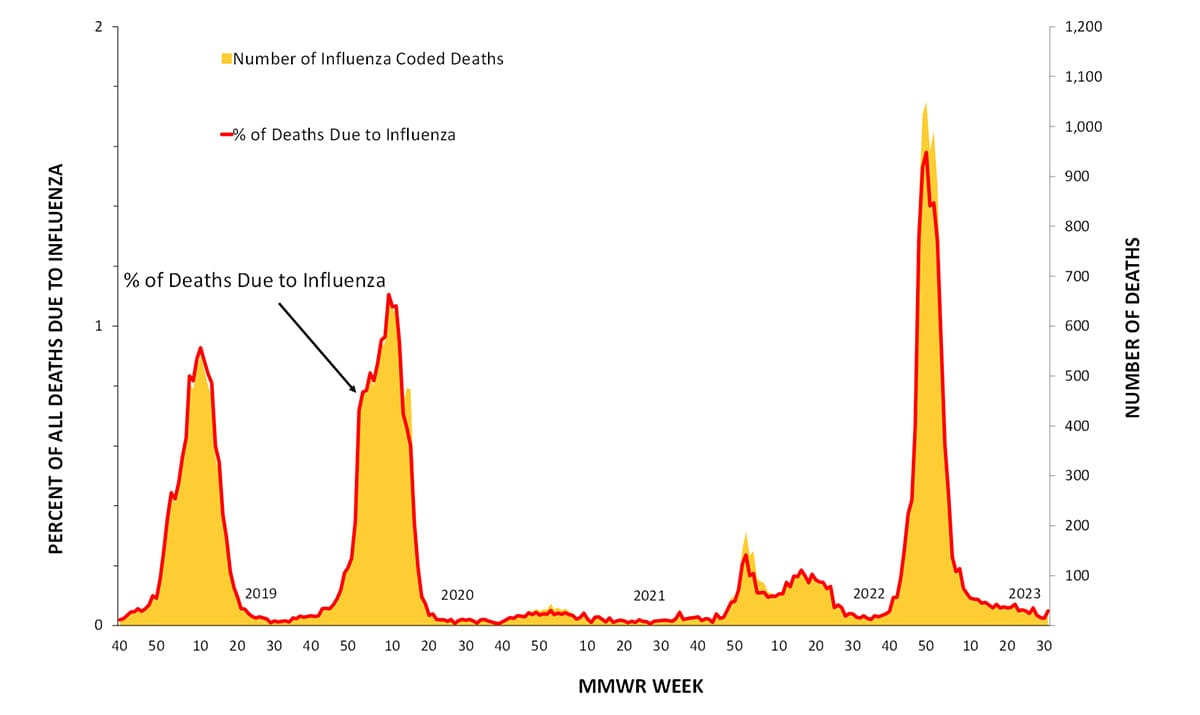
According to the National Center for Health Statistics (NCHS) Mortality Surveillance System1 as of September 14, 2023, during October 2, 2022–September 9, 2023, the weekly percentage of deaths due to pneumonia, influenza, or COVID-19 (PIC) peaked at 12.7% during the week ending January 7, 2023 (week 1). Of note, the percentage of deaths due to PIC was below the epidemic threshold for the first time since the start of the COVID-19 pandemic during the week ending June 17, 2023 (week 24) and dropped below the epidemic threshold again during the weeks ending July 1, 2023, and July 22, 2023 (weeks 26 and 29) (Figure 10). Of the 241,969 PIC deaths reported between October 2, 2022–September 9, 2023, 82,786 (34.2%) had COVID-19 listed as an underlying or contributing cause of death, and 9,697 (4.0%) listed influenza, indicating that PIC–associated mortality during the 2022–2023 season was still due primarily to COVID-19 and not influenza1. The highest weekly count of deaths due to influenza was 1,048 (1.6% of all deaths), occurring the week ending December 17, 2022 (week 50) (Figure 11).
Figure 10. Pneumonia, Influenza, and COVID-19 Mortality from the National Center for Health Statistics Mortality Surveillance System, 2018–2019 to 2022–2023 Seasons
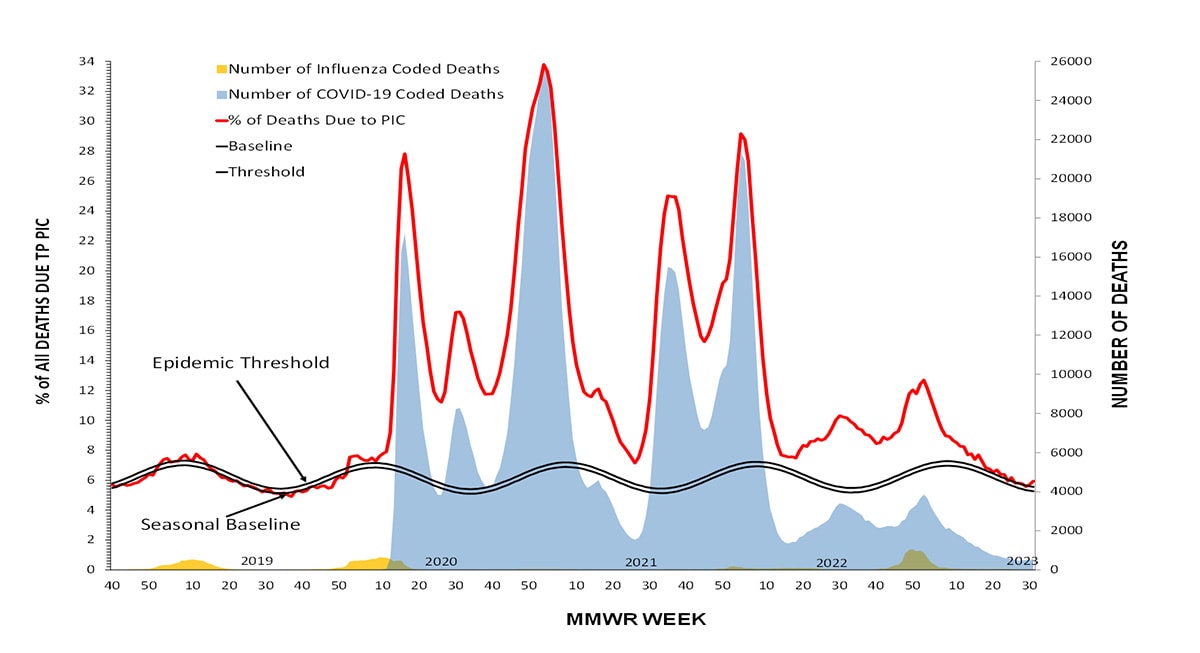
Figure 11. Influenza Mortality from the National Center for Health Statistics Mortality Surveillance System, 2018–2019 to 2022–2023 Seasons
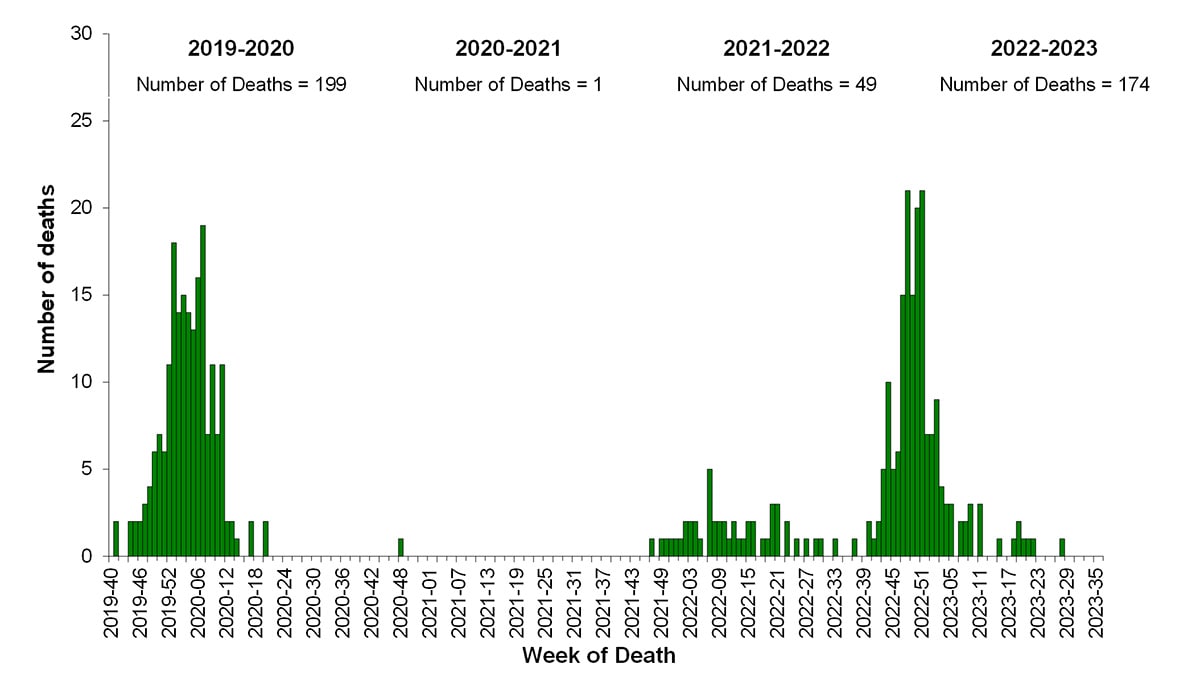
CDC monitors influenza-associated deaths in children younger than 18 years of age through the Influenza-Associated Pediatric Mortality Surveillance System1. During October 2, 2022–September 9, 2023, a total of 174 laboratory-confirmed influenza-associated pediatric deaths were reported to CDC (Figure 9); this is the third largest number of pediatric deaths reported during a seasonal influenza epidemic (2019–2020 [199 deaths], 2017–2018 [188 deaths]) since reporting began during the 2004–2005 season. This season, 163 of the reported deaths were associated with influenza A viruses and 11 were associated with influenza B viruses. Of 88 influenza A viruses with a reported subtype, 68 (77%) were influenza A (H3N2), 19 (22%) were influenza A (H1N1), and one (1%) was a coinfection with influenza A (H1N1) and influenza A (H3N2). All three influenza B deaths with a reported lineage were caused by influenza B/Victoria lineage viruses. No pediatric deaths associated with influenza B/Yamagata have been reported since the 2017–2018 season. The mean age at death was 7 years (range = 3 weeks–17 years). Of 172 children and adolescents with known location of death, 80 (47%) died after hospital admission; 59 (34%) died in an emergency room; and 33 (19%) died outside a hospital setting. Among the 164 children and adolescents with a known medical history, 73 (45%) had at least one underlying medical condition associated with higher risk for developing serious influenza-related complications. Among the 131 children and adolescents who were eligible for influenza vaccination (age ≥6 months at date of illness onset) and for whom vaccination status was known, 109 (83%) were not fully vaccinated.
Figure 12. Number of Influenza-Associated Pediatric Deaths by Week of Death, 2019–2020 to 2022–2023 Seasons
Burden estimates
CDC does not know the exact number of people who have been sick and affected by influenza because influenza is not a reportable disease in most areas of the United States. However, CDC uses a mathematical model to estimate the number of influenza illnesses, medical visits, hospitalizations, and deaths that occur each season5. Preliminary in-season estimates of influenza burden in the United States for the 2022–2023 season are that influenza virus infection resulted in 31 million symptomatic illnesses, 14 million medical visits, 360,000 hospitalizations, and 21,000 deaths. Preliminary end of season burden estimates for the 2022–2023 season will be available in October 2023.
Influenza activity in the southern hemisphere
Influenza activity in the Southern Hemisphere typically occurs between April and September and can last into October or November. In the Northern Hemisphere, the influenza season can begin as early as October and can last as late as April or May. According to data collected and submitted by countries to the World Health Organization's FluNet system6, influenza activity in the Southern Hemisphere is ongoing as of August 2023, with influenza A viruses being reported most often and influenza A(H1N1)pdm09 being the predominant subtype.
Some South American countries experienced early or high levels of influenza activity compared to their historic trends. For example, activity in Chile began earlier than historic trends, while activity in Paraguay ended earlier than usual, and activity in Bolivia was both higher and earlier compared to historic data. South Africa, one of the few Southern Hemisphere countries with predominantly influenza A(H3N2) virus activity, experienced a high percentage of respiratory specimens testing positive for influenza but a moderate level of influenza-related hospitalizations compared to historic trends7. Activity in South Africa declined earlier than what has been seen historically. Similar to South Africa, influenza activity in Australia decreased earlier during the 2023 season as compared to historic trends.
Of note, Mexico, located in the Northern Hemisphere, traditionally experiences peak influenza circulation during the October–March season but had atypically high influenza activity during the Southern Hemisphere season and saw primarily influenza B/Victoria virus circulation. In the tropical countries of Bangladesh and Thailand, the 2023 influenza season began later than previous seasons and activity is still above epidemic thresholds.
Discussion
The 2022–2023 influenza season in the United States is considered moderately severe with an estimate of at least 31 million symptomatic illnesses, 14 million medical visits, 360,000 hospitalizations, and 21,000 deaths caused by influenza virus infection. The predominant influenza virus throughout the 2022–2023 influenza season was influenza A(H3N2); however, as activity declined, A(H1N1)pdm09 and B/Victoria viruses began circulating at higher proportions than A(H3N2) viruses. Most influenza viruses tested were in the same genetic subclade as, and antigenically similar to, the vaccine reference viruses included in the season's influenza vaccine. All the influenza viruses collected and tested for antiviral resistance by CDC since October 2, 2022, were susceptible to zanamivir, and peramivir and the majority (>99%) were susceptible to oseltamivir and baloxivir.
This season marked a return to influenza activity at levels more similar to those seen prior to the COVID-19 pandemic. The peak percentage of specimens testing positive for influenza (26.3%) as reported to CDC from clinical laboratories nationally was similar to the average peak percentage positive (26.5%) during the five influenza seasons (2015–2016 through 2019–2020) immediately preceding the COVID-19 pandemic. Similarly, the cumulative rate of influenza-associated hospitalizations as reported in FluSurv-NET this season was similar to hospitalization rates for 4 pre-COVID seasons (2014–2015, 2016–2017, 2018–2019, and 2019–2020 seasons) and higher than all but one remaining season (2017–18 season) since the 2010–11 season.
Mortality attributed to influenza also returned to levels more similar to what was seen before the COVID-19 pandemic. As of September 14, 2023, the number of death certificates with influenza listed as an underlying or contributing cause of death during the 2022–2023 season (9,697) was above the average number of influenza coded deaths (8,530) during the five seasons preceding the COVID-19 pandemic (2015–2016 through 2019–2020) and 3 to 10 times higher than the number of influenza coded deaths during the first two years of the COVID-19 pandemic. The number of pediatric deaths reported this season (174) was above the average reported number of deaths each season (147) for the five seasons preceding the COVID-19 pandemic.
Although influenza activity in the United States returned to levels similar to pre-COVID-19 influenza seasons, timing of activity occurred earlier than usual. During the 2022–2023 season, activity peaked nationally between late November and early December (depending on the indicator) which is at least three weeks before the earliest recorded seasonal peak going back to the 1997–1998 season and two months before the most common month for peak influenza activity (February). Influenza activity returned to interseasonal levels in February 2023, and no significant second wave of activity was reported.
While not always a predictor of the subsequent Northern Hemisphere influenza season, Southern Hemisphere activity in the summer is often considered when planning for what could be expected. However, due to continued varied influenza activity among Southern Hemisphere countries, different influenza viruses predominating in different parts of the world, and the possibility of variations in population immunity between the Northern and Southern Hemispheres, Southern Hemisphere activity cannot be used to definitively predict the timing or intensity of influenza activity in the United States this fall and winter.
Though influenza activity has remained low in the summer, maintaining vigilance for influenza virus infections in the United States year-round is important. Sporadic seasonal influenza virus infections and novel influenza A infections associated with exposure to swine during animal exhibitions often are reported during the summer months8. While the number of outbreaks of highly pathogenic avian influenza A(H5N1) virus among birds has been low in this summer it is important that providers and persons with exposure to sick or infected birds remain attentive to any new symptoms that could be consistent with influenza virus infection4. Patients with suspected novel influenza A virus infection should isolate at home away from household members and not go to work or school until they are proven not to be infected or have recovered from their illness. Specimens from patients with suspected novel influenza A virus infection should be collected and referred to state public health departments for testing and treatment with influenza antiviral medications should be initiated immediately.
While we do not know exactly what the coming influenza season will look like, influenza results in a significant public health burden in the United States every winter. For persons aged ≥6 months, receiving a seasonal influenza vaccine each year remains the best way to protect against seasonal influenza and its potentially severe consequences. There are also everyday preventive actions, including avoiding close contact with people who are sick, limiting contact with others if you are sick, and covering your coughs and sneezes, that can help reduce the spread of influenza. Influenza antiviral drugs are another way to minimize the impact of influenza this coming season. CDC recommends initiating influenza antiviral drug treatment as soon as possible for patients with confirmed or suspected influenza virus infection who have severe, complicated, or progressive illness; who require hospitalization; or who are at increased risk for influenza-associated complications9. Four influenza antiviral drugs approved by the Food and Drug Administration are currently recommended for use in the United States.
Influenza surveillance reports for the United States are posted online weekly. Additional information regarding influenza viruses, surveillance, vaccines, antiviral medications, and novel influenza A infections in humans is available online.
Contributors:
P Daly, MPH. A Colón, MPH. A Merced-Morales, MPH. J Barnes, PhD. C Bozio, MPH. T Davis, PhD. N Dempster, MPH. L Duca, PhD. S Garg, MD. L Gubareva, PhD. D Hawkins, MPH. A Howa, MPH. S Huang, MPH. D Iuliano, PhD, MPH. K Kniss, MPH. R Kondor, PhD. P Marcenac, PhD. S Moon, PhD. B Natkin, MPH. A O'Halloran, MSPH. YC Pun, MPH. J Steel, PhD. K Tastad, PhD, MPH. D Ujamaa, MS. D Wentworth, PhD. B Winterton, MPH. A Budd, MPH; Influenza Division.
Acknowledgements:
State, county, city, and territorial health departments and public health laboratories; U.S. World Health Organization collaborating laboratories; National Respiratory and Enteric Virus Surveillance System laboratories; U.S. Outpatient Influenza-Like Illness Surveillance Network sites; FluSurv-NET; the National Center for Health Statistics, CDC; Anwar Abd Elal, Ha Nguyen, Philippe Pascua, Mira Patel, Shannon Crenshaw, Angie Foust, Gabriela Jasso, Melissa Lange, Justine Lyons, Kyung Park, Nicholas Pearce, Thomas Rowe, Wendy Sessions, Svetlana Shcherbik, Ansley Smith, Catherine Smith, Norman Hassell, Thomas Stark, Jimma Liddell, Kay Radford, Phili Wong, Marie Kirby, Juliana DaSilva, Lisa Keong, Julia Fredrick, Sydney Sheffield, Ewelina Lyszkowicz, Influenza Division, National Center for Immunization and Respiratory Diseases, CDC.
- U.S. Influenza Surveillance: Purpose and Methods. (2022, October 14). Center for Disease Control and Prevention. Retrieved August 17, 2023, from https://www.cdc.gov/flu/weekly/overview.htm
- Influenza Vaccine for the 2022–2023 Season. (2022, July 06). Retrieved from U.S. Food & Drug Administration: https://www.fda.gov/vaccines-blood-biologics/lot-release/influenza-vaccine-2022-2023-season
- Influenza Vaccine for the 2023–2024 Season. (2023, July 3). Retrieved from U.S. Food & Drug Administration: https://www.fda.gov/vaccines-blood-biologics/lot-release/influenza-vaccine-2023-2024-season
- Technical Report: Highly Pathogenic Avian Influenza A(H5N1) Viruses. (2023, July 7). Centers for Disease Control and Prevention. Retrieved August 17, 2023, from https://www.cdc.gov/flu/avianflu/spotlights/2022-23/h5n1-technical-report_june.htm
- How CDC Estimates the Burden of Seasonal Influenza in the U.S. (2019, November). Centers for Disease Control and Prevention. Retrieved on August 29, 2023. https://www.cdc.gov/flu/about/burden/how-cdc-estimates.htm
- Influenza surveillance outputs. (2023). World Health Organization. Retrieved August 14, 2023, from https://www.who.int/teams/global-influenza-programme/surveillance-and-monitoring/influenza-surveillance-outputs
- The National Institute For Communicable Diseases. (n.d.). Weekly Respiratory Pathogens Surveillance Report Week–NICD. National Institute of Communicable Diseases. Retrieved August 14, 2023, from https://www.nicd.ac.za/diseases-a-z-index/disease-index-covid-19/surveillance-reports/weekly-respiratory-pathogens-surveillance-report-week
- Variant Influenza Viruses: Background and CDC Risk Assessment and Reporting (2023, May). Centers for Disease Control and Prevention. Retrieved on August 29, 2023. https://www.cdc.gov/flu/swineflu/variant.htm
- Flu: What To Do If You Get Sick (2022, December). Centers for Disease Control and Prevention. Retrieved on August 29, 2023. https://www.cdc.gov/flu/treatment/takingcare.htm
